
Planning rows with neighbours, living conditions and children’s services are just some of the reasons residents are frustrated with their local councils.
Recent cuts to council budgets have resulted in a squeeze on the services they provide. Sectors such as Children and Education Services, Housing and Benefits have been affected but some councils are weathering the storm better than others.
To gain a true understanding of council performance, Legal Expert investigated the number of complaints lodged against each Metropolitan Council in the UK.
How Legal Expert Can Help
The team at Legal Expert offer free advice and support in relation to injuries resulting from council-caused incidents. For example, a trip and fall over a pothole or injuries caused by the disrepair of a council house.
You can learn more about council compensation claims here, or contact us to get free advice.
How We Conducted Our Research Into Council Satisfaction
We sent Freedom of Information Requests to the Government and Social Care Ombudsman asking for the number of complaints that have be lodged against every UK Metropolitan Council in the last financial year (between April 6 – April 5 2023/24).
The Ombudsman is the final stage for complaints about councils, if residents are not happy with the outcome of the initial process.
We also asked what service the complaints pertained to for example, Housing or Environmental Services.
Lastly, we asked how the complaints were dealt with. For instance, how many were upheld, how many were closed after initial enquiries and how many were not referred back for local resolution.
Discover The Results Of Our Research Into Complaints Against Local Councils
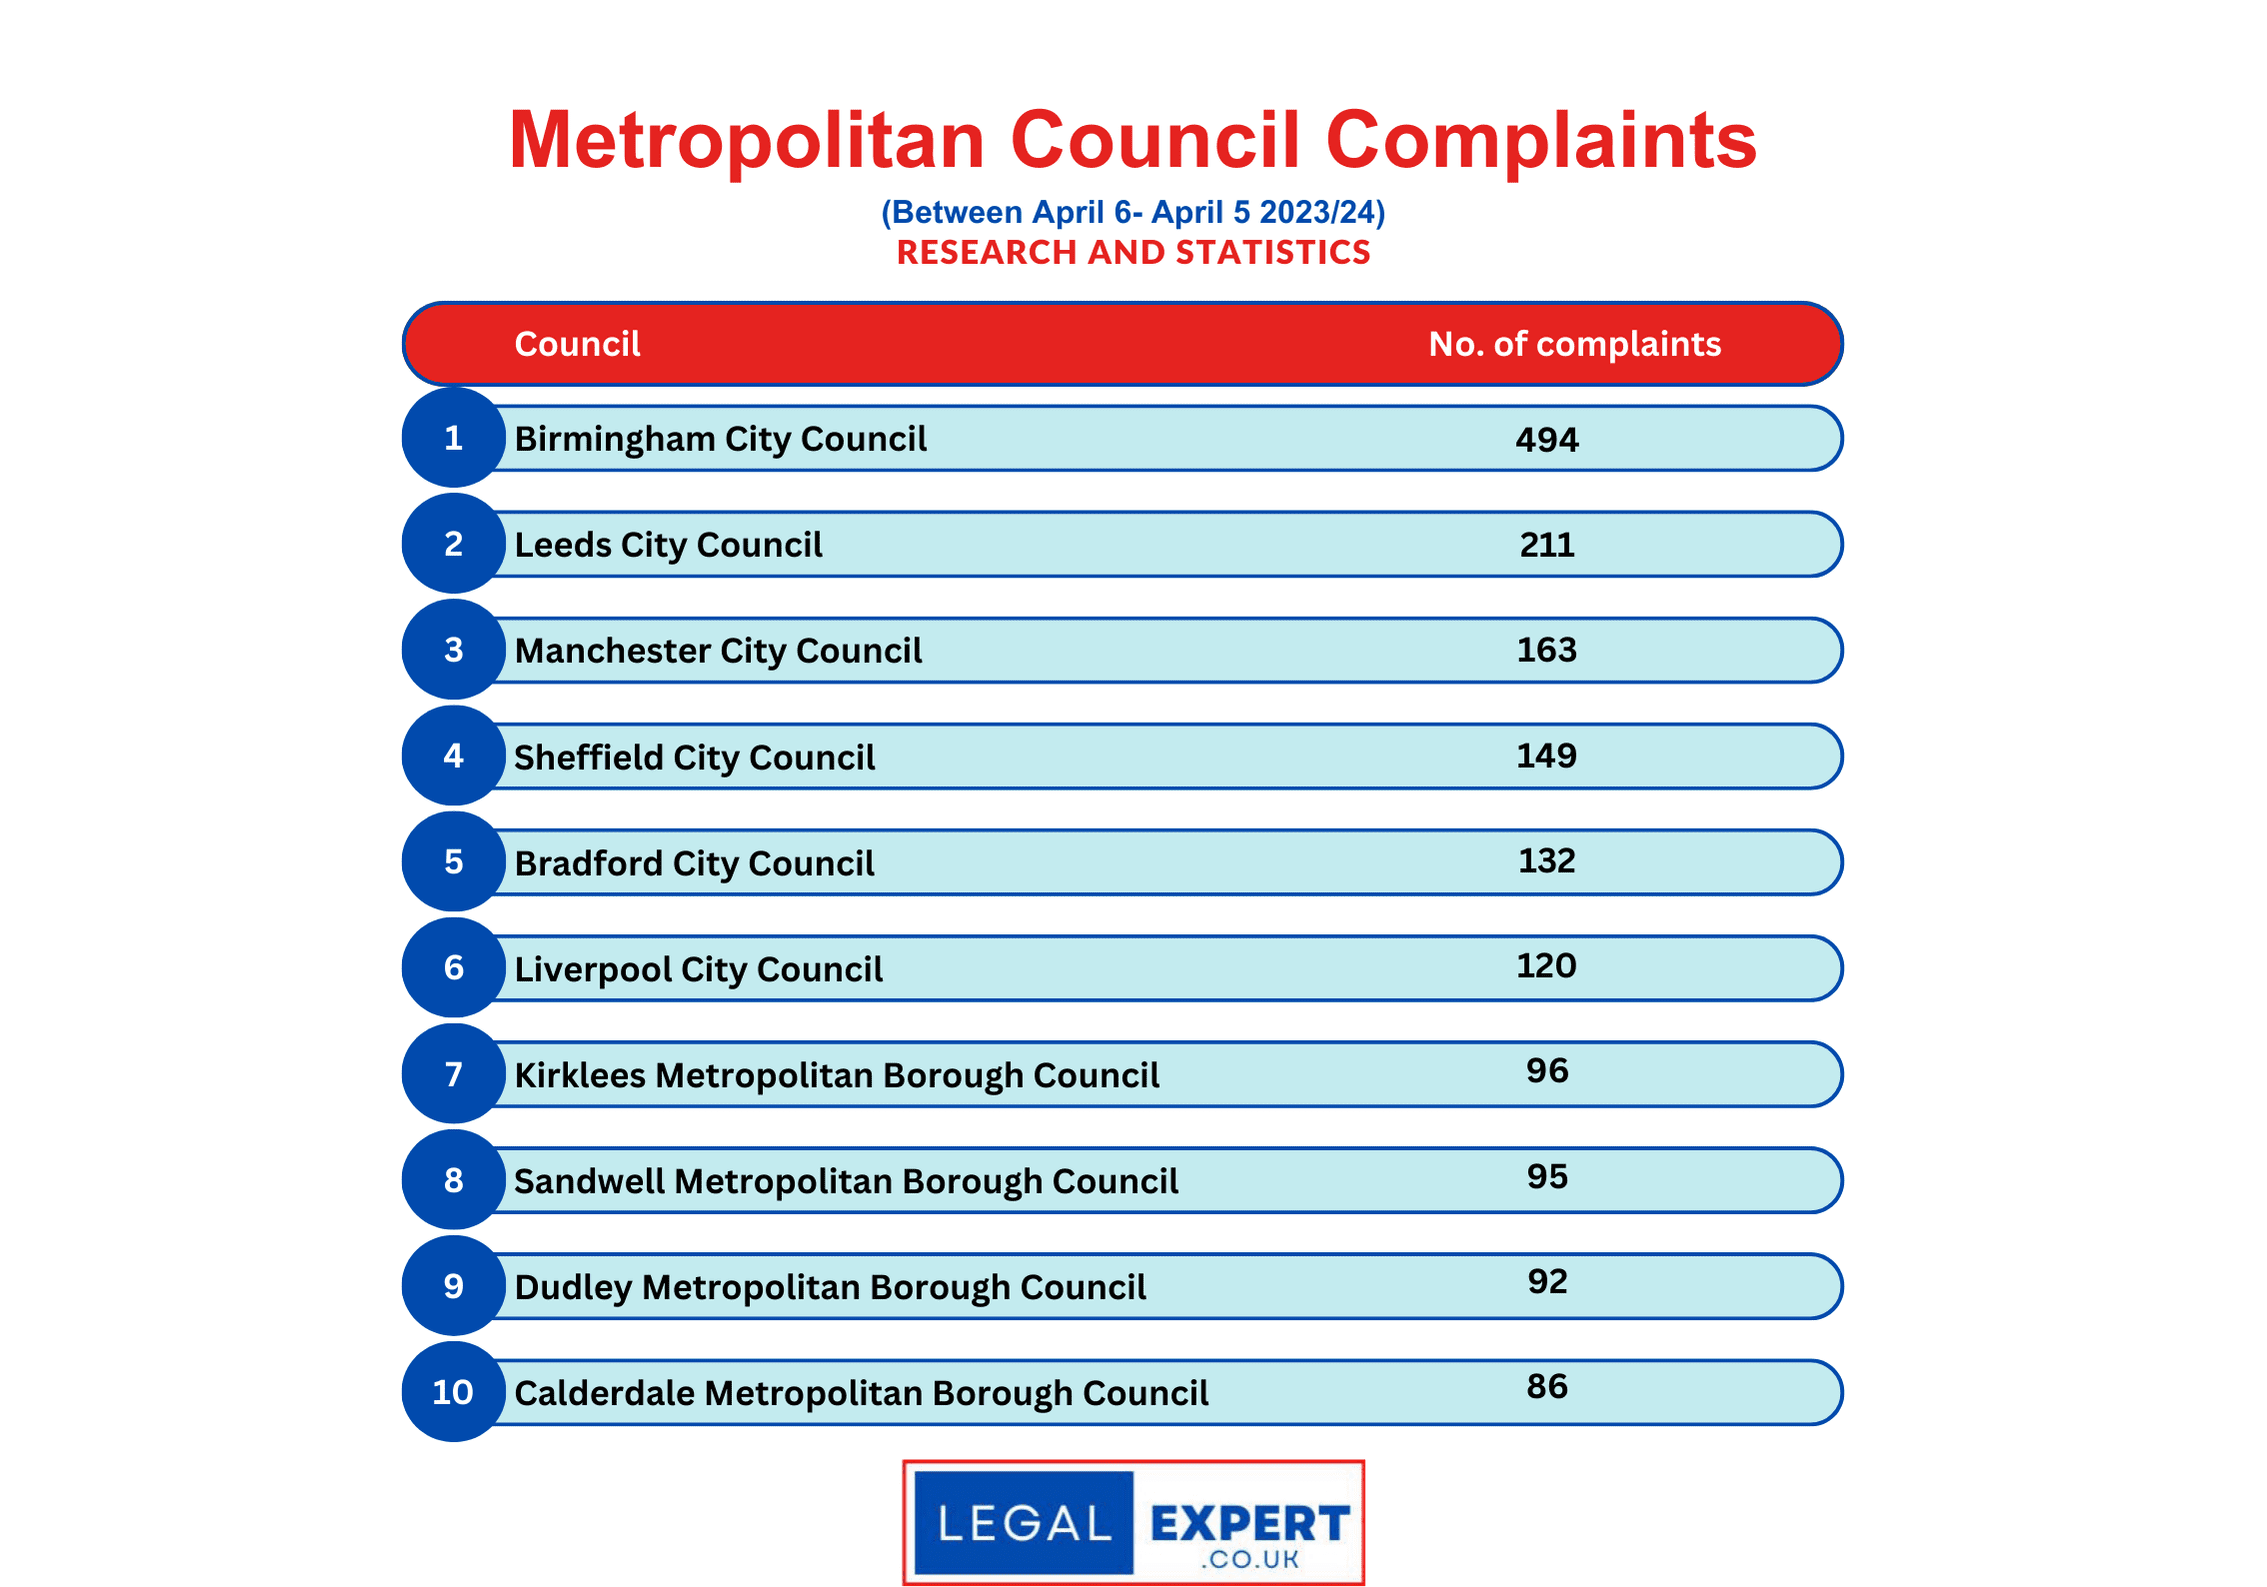
The total number of complaints lodged against Metropolitan Councils was 3,231 in the last financial year alone. That equates to around 9 every day.
Out of 32 UK Metropolitan Councils, Birmingham City Council had the most complaints, according to the Ombudsman figures.
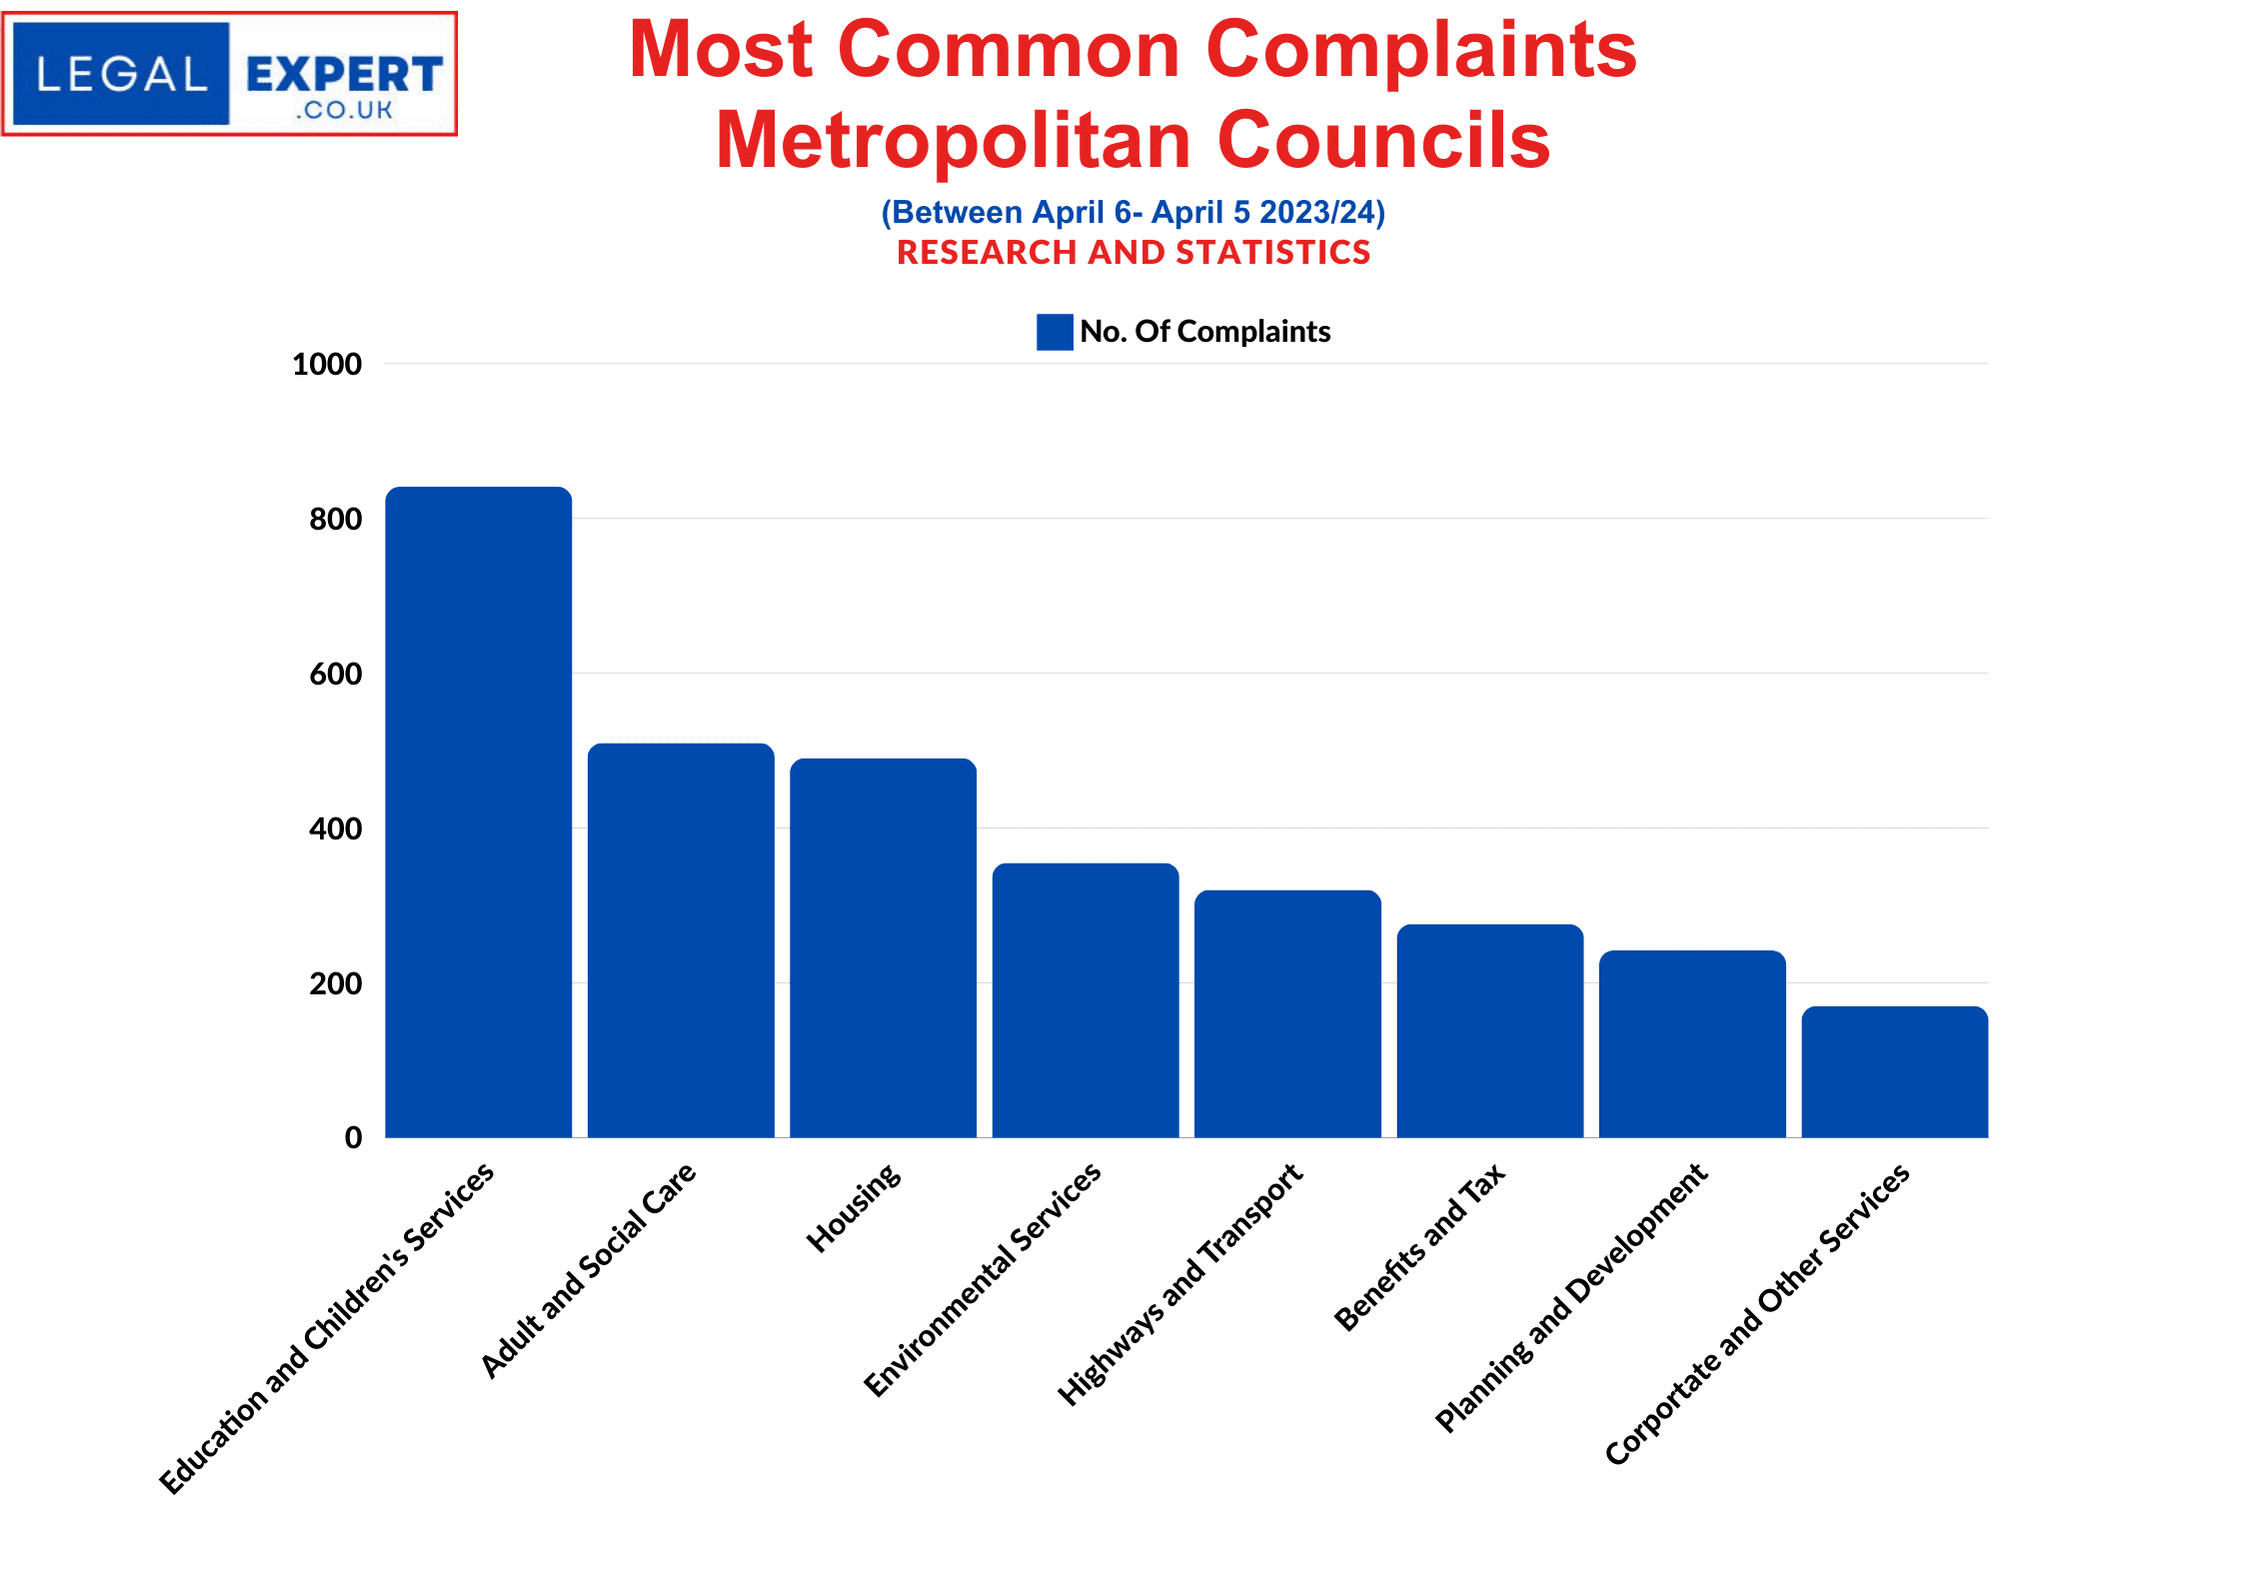
The most complained about services nation-wide was Education and Children’s Services which had a total of 841 across all Metropolitan Councils.
National Outlook
Council Complaints – All Metropolitan Councils
The Ombudsman is the final stage of complaints about councils if residents are not happy with the outcome of complaining directly to their local authority.
Birmingham City Council was revealed as the most complained about Metropolitan Local Authority in England by far, with 494 complaints made to the Ombudsman last year – equating to more than one a day.
Coming in second was Leeds City Council which had 211 complaints, followed by Manchester City Council with 163.
The most complained about services in Metropolitan Councils
In its latest report, July 24, the Ombudsman criticised councils in England for ‘failing to deliver improvements on time.’
Ms Amerdeep Somal, Local Government and Social Care Ombudsman, said: “What we’re seeing in the majority of cases isn’t a lack of care or an inability to take responsibility for what has gone wrong, but a sector struggling to cope.”
The most complained about sector across the 36 Metropolitan Councils was Education and Children’s Services which could include children’s social services or school’s actions, such as bullying, policy changes, or failure to support children with special educational needs.
Some 841 such complaints were made to the Ombudsman, the most being for Birmingham City Council, which had 85, followed by Leeds City Council which had 70.
Adult and Social Care had the second highest complaint figures, which could include poor-quality care, fees and charging disputes, delays, assessments of need or safety and safeguarding issues.
A total of 510 such complaints were assessed by the Ombudsman, with 42 relating to Birmingham City Council. Bradford and Leeds Council logged a further 28 complaints each and Sheffield Council had 26.
Other common grievances included: Environmental Services (52), Housing (42). Corporate Services (25) and Highways and Transport (23).
Of these complaints, 390 were upheld and another 876 were referred back to the council for local resolution.
The Ombudsman provided advice in 157 cases, while 1,301 complaints were closed after initial enquiries, meaning there was no case for the council to answer.
A further 108 complaints were not upheld.
Ombudsman Ms Somal added: “Councils want to comply with our recommendations, accept responsibility when things go wrong, and provide good services to residents, and our 99.5% compliance rate indicates this is the case. But all too often resources and finances prevent them from doing so as swiftly as they should.”
Birmingham City Council
Council Complaints – Birmingham City Council
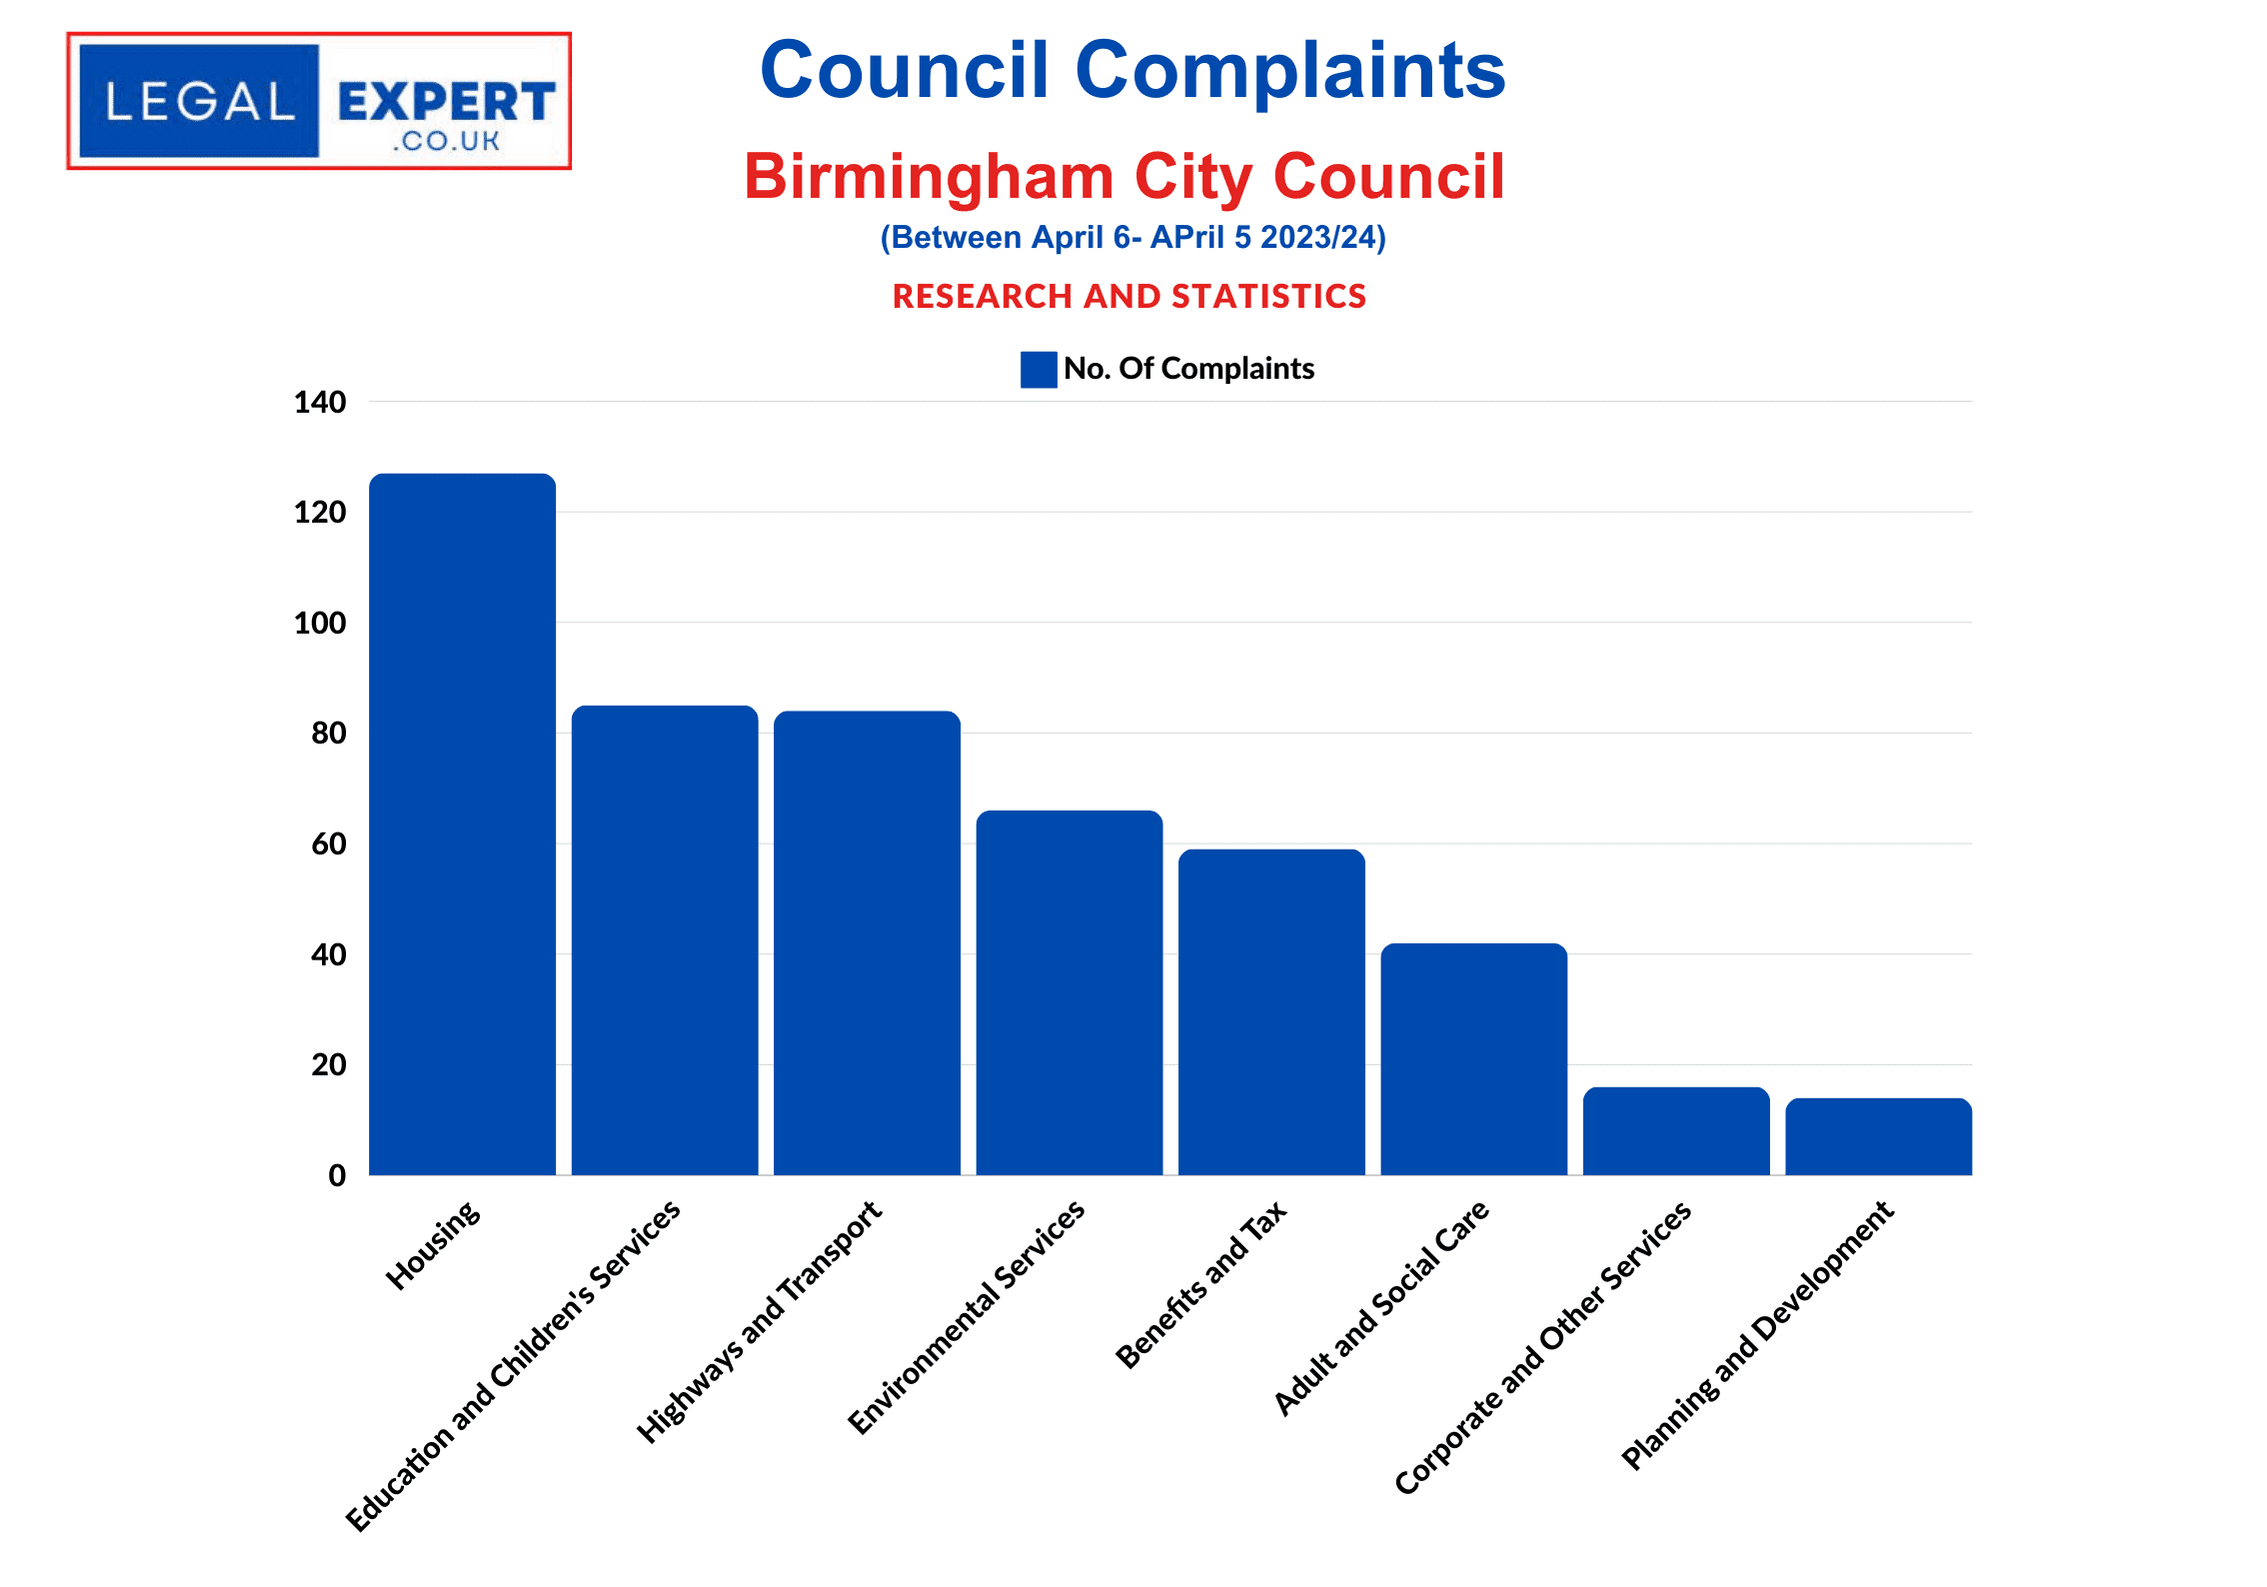
Birmingham City Council was subject to 510 complaints to the Ombudsman, that’s more one a day.
The most common complaint related to housing, which could include poor living conditions. Some 127 (25%) of complaints assessed by the complaints body pertained to housing.
The second most common issue plaguing Birmingham City residents were in Education and Children’s Services which had 85 complaints.
Other common reasons were; Highways and Transport (84), Environmental Services, Public Protection and Regulation (66), and Benefits and Tax (59).
Of these complaints, 71 were upheld and another 145 ‘referred back for local resolution’, while ;advice’ was given in 19 other cases.
Some 176 were ‘closed after initial enquiries,’ meaning there was no case for the council to answer while another 14 were not upheld.
Leeds City Council
Council Complaints – Leeds City Council
Leeds City Council has received some of the highest number of complaints out of all Metropolitan Councils in the UK.
The majority of complaints lodged against the council were regarding Education and Children’s Services.
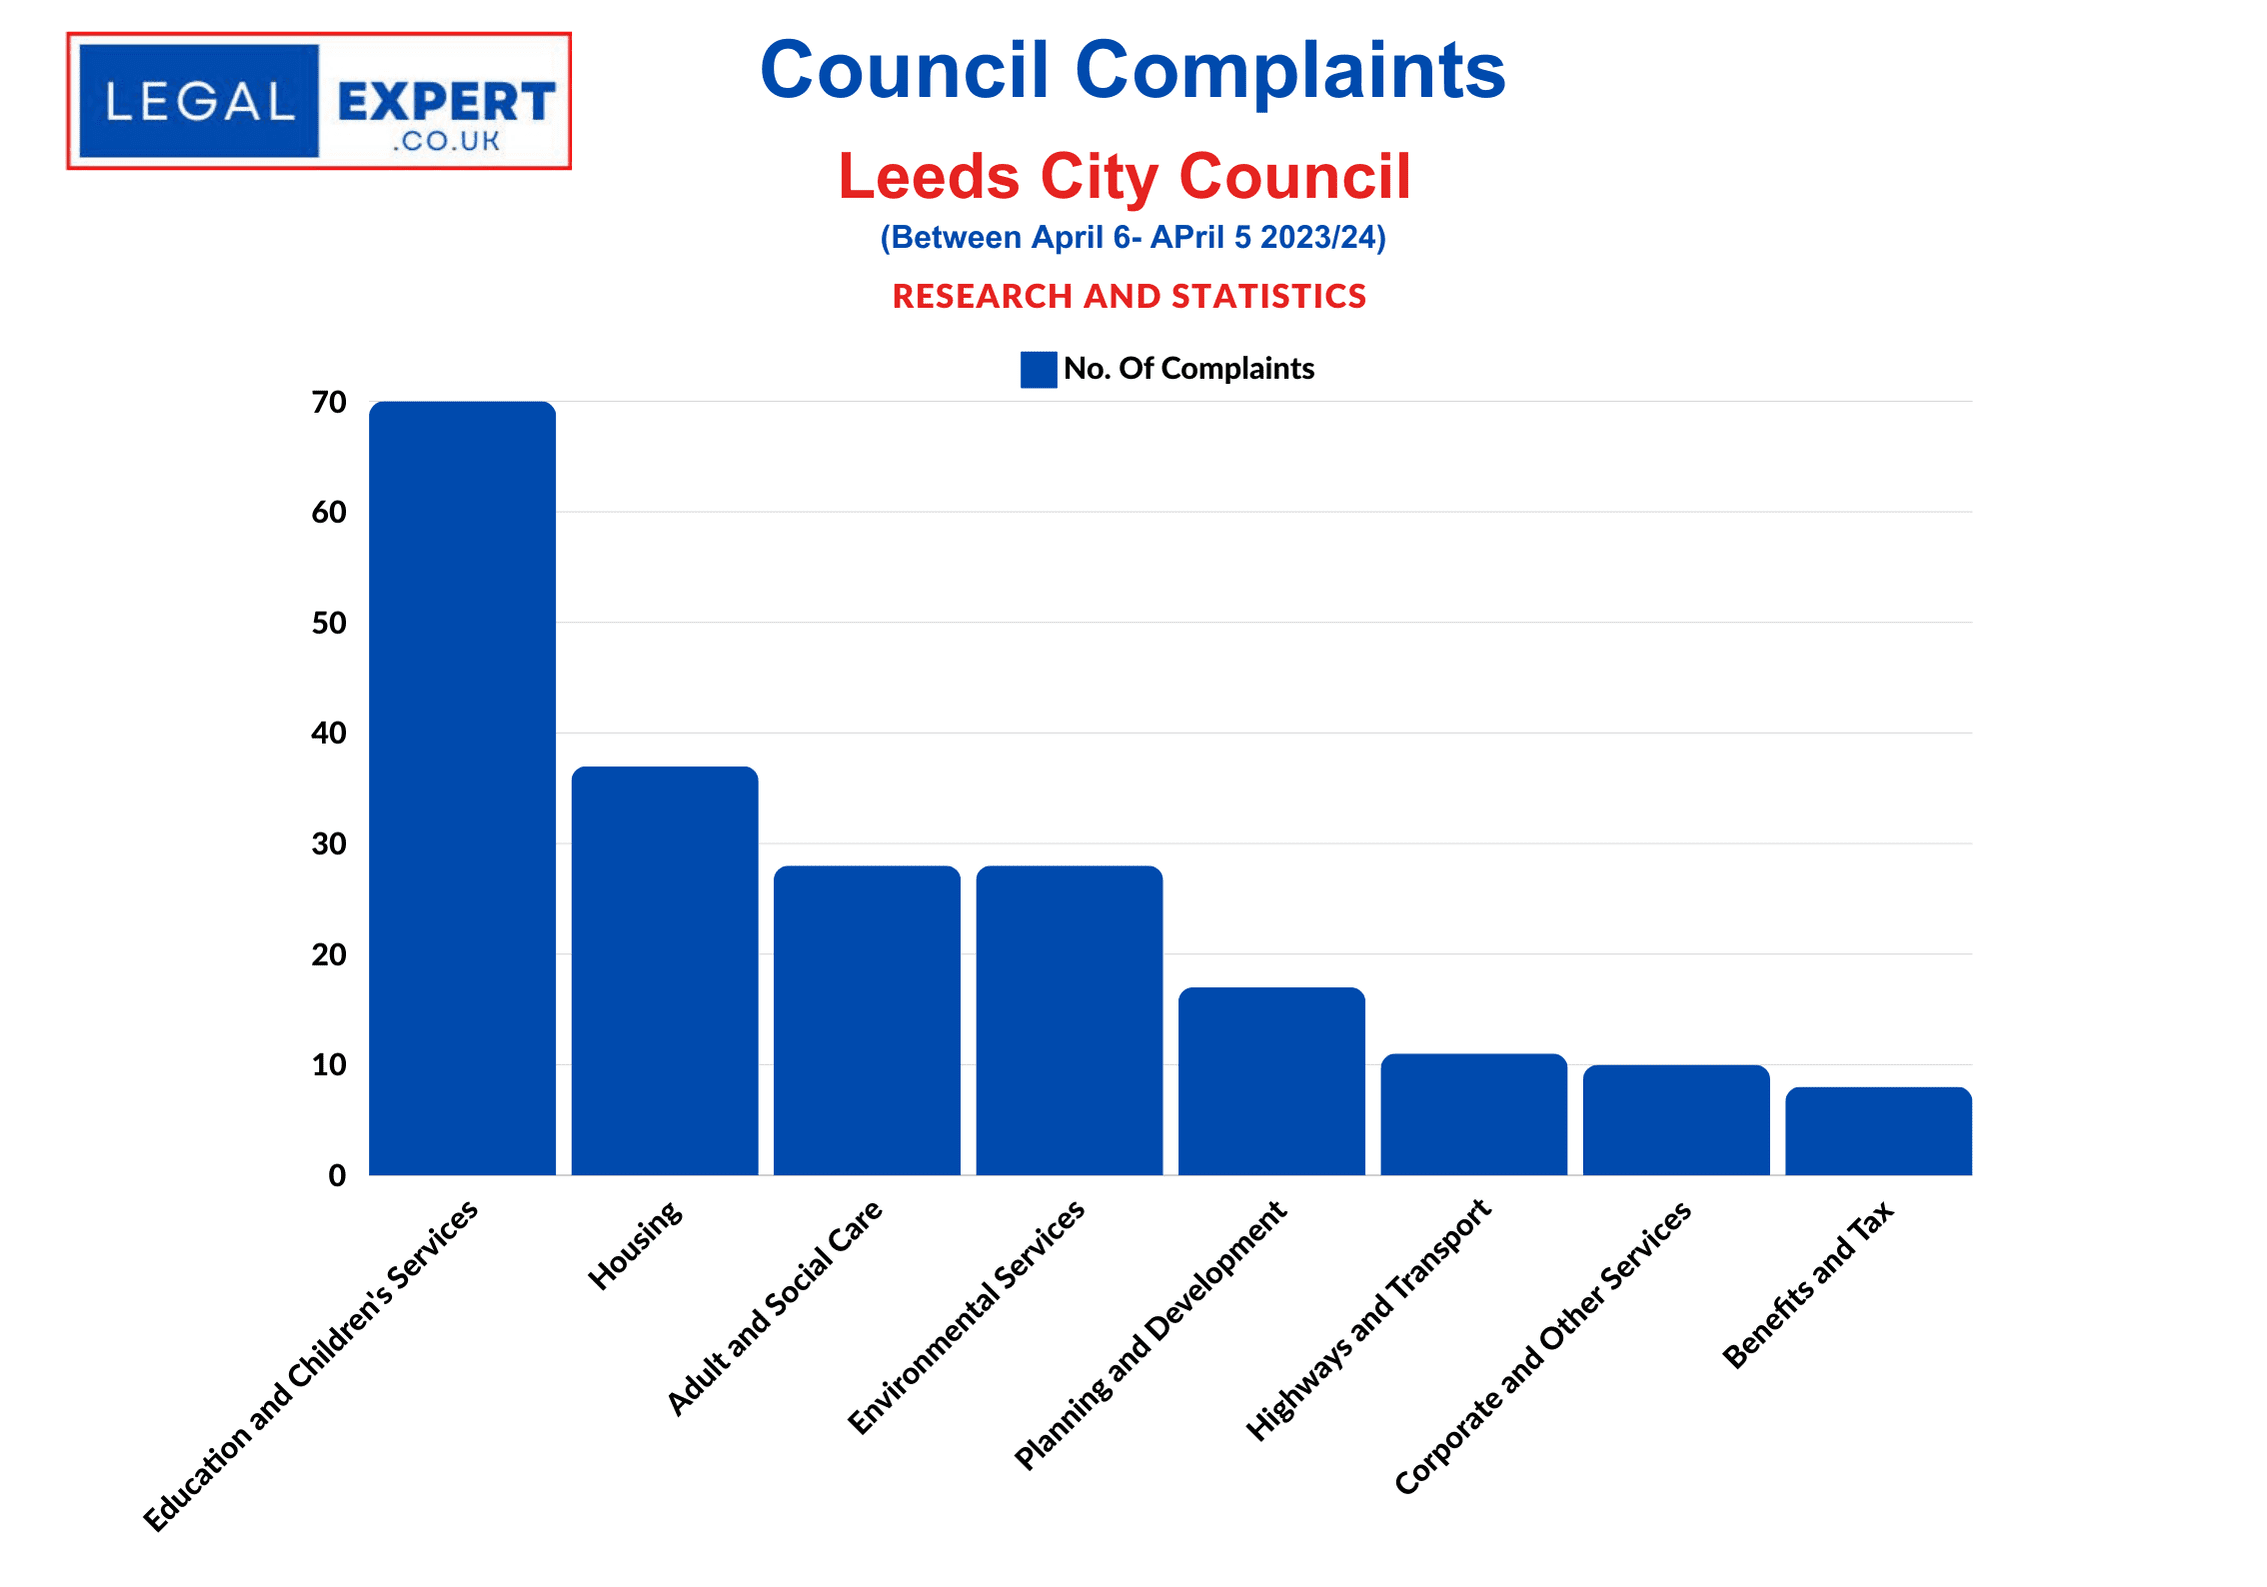
Leeds City Council was subject to 211 complaints to the Ombudsman in the last year.
The most common complaint related to Education and Children’s Services, which could include children’s social services or school’s actions, such as bullying, policy changes, or failure to support children with special educational needs.
A total of 70 such complaints were assessed by the Ombudsman, accounting for 33% of all complaints lodged against the council in 2023/24.
The second most common issue plaguing Leeds City residents was housing which had 37 complaints.
Other common reasons were: Adult and Social Care (28), Environmental Services (28), Planning and Development (17) and Highways and Transport (11).
Of these complaints, 42 were upheld and another 37 ‘referred back for local resolution’, while ‘advice’ was given in 19 other cases.
Some 67 were ‘closed after initial enquiries,’ meaning there was no case for the council to answer, while another 9 were not upheld.
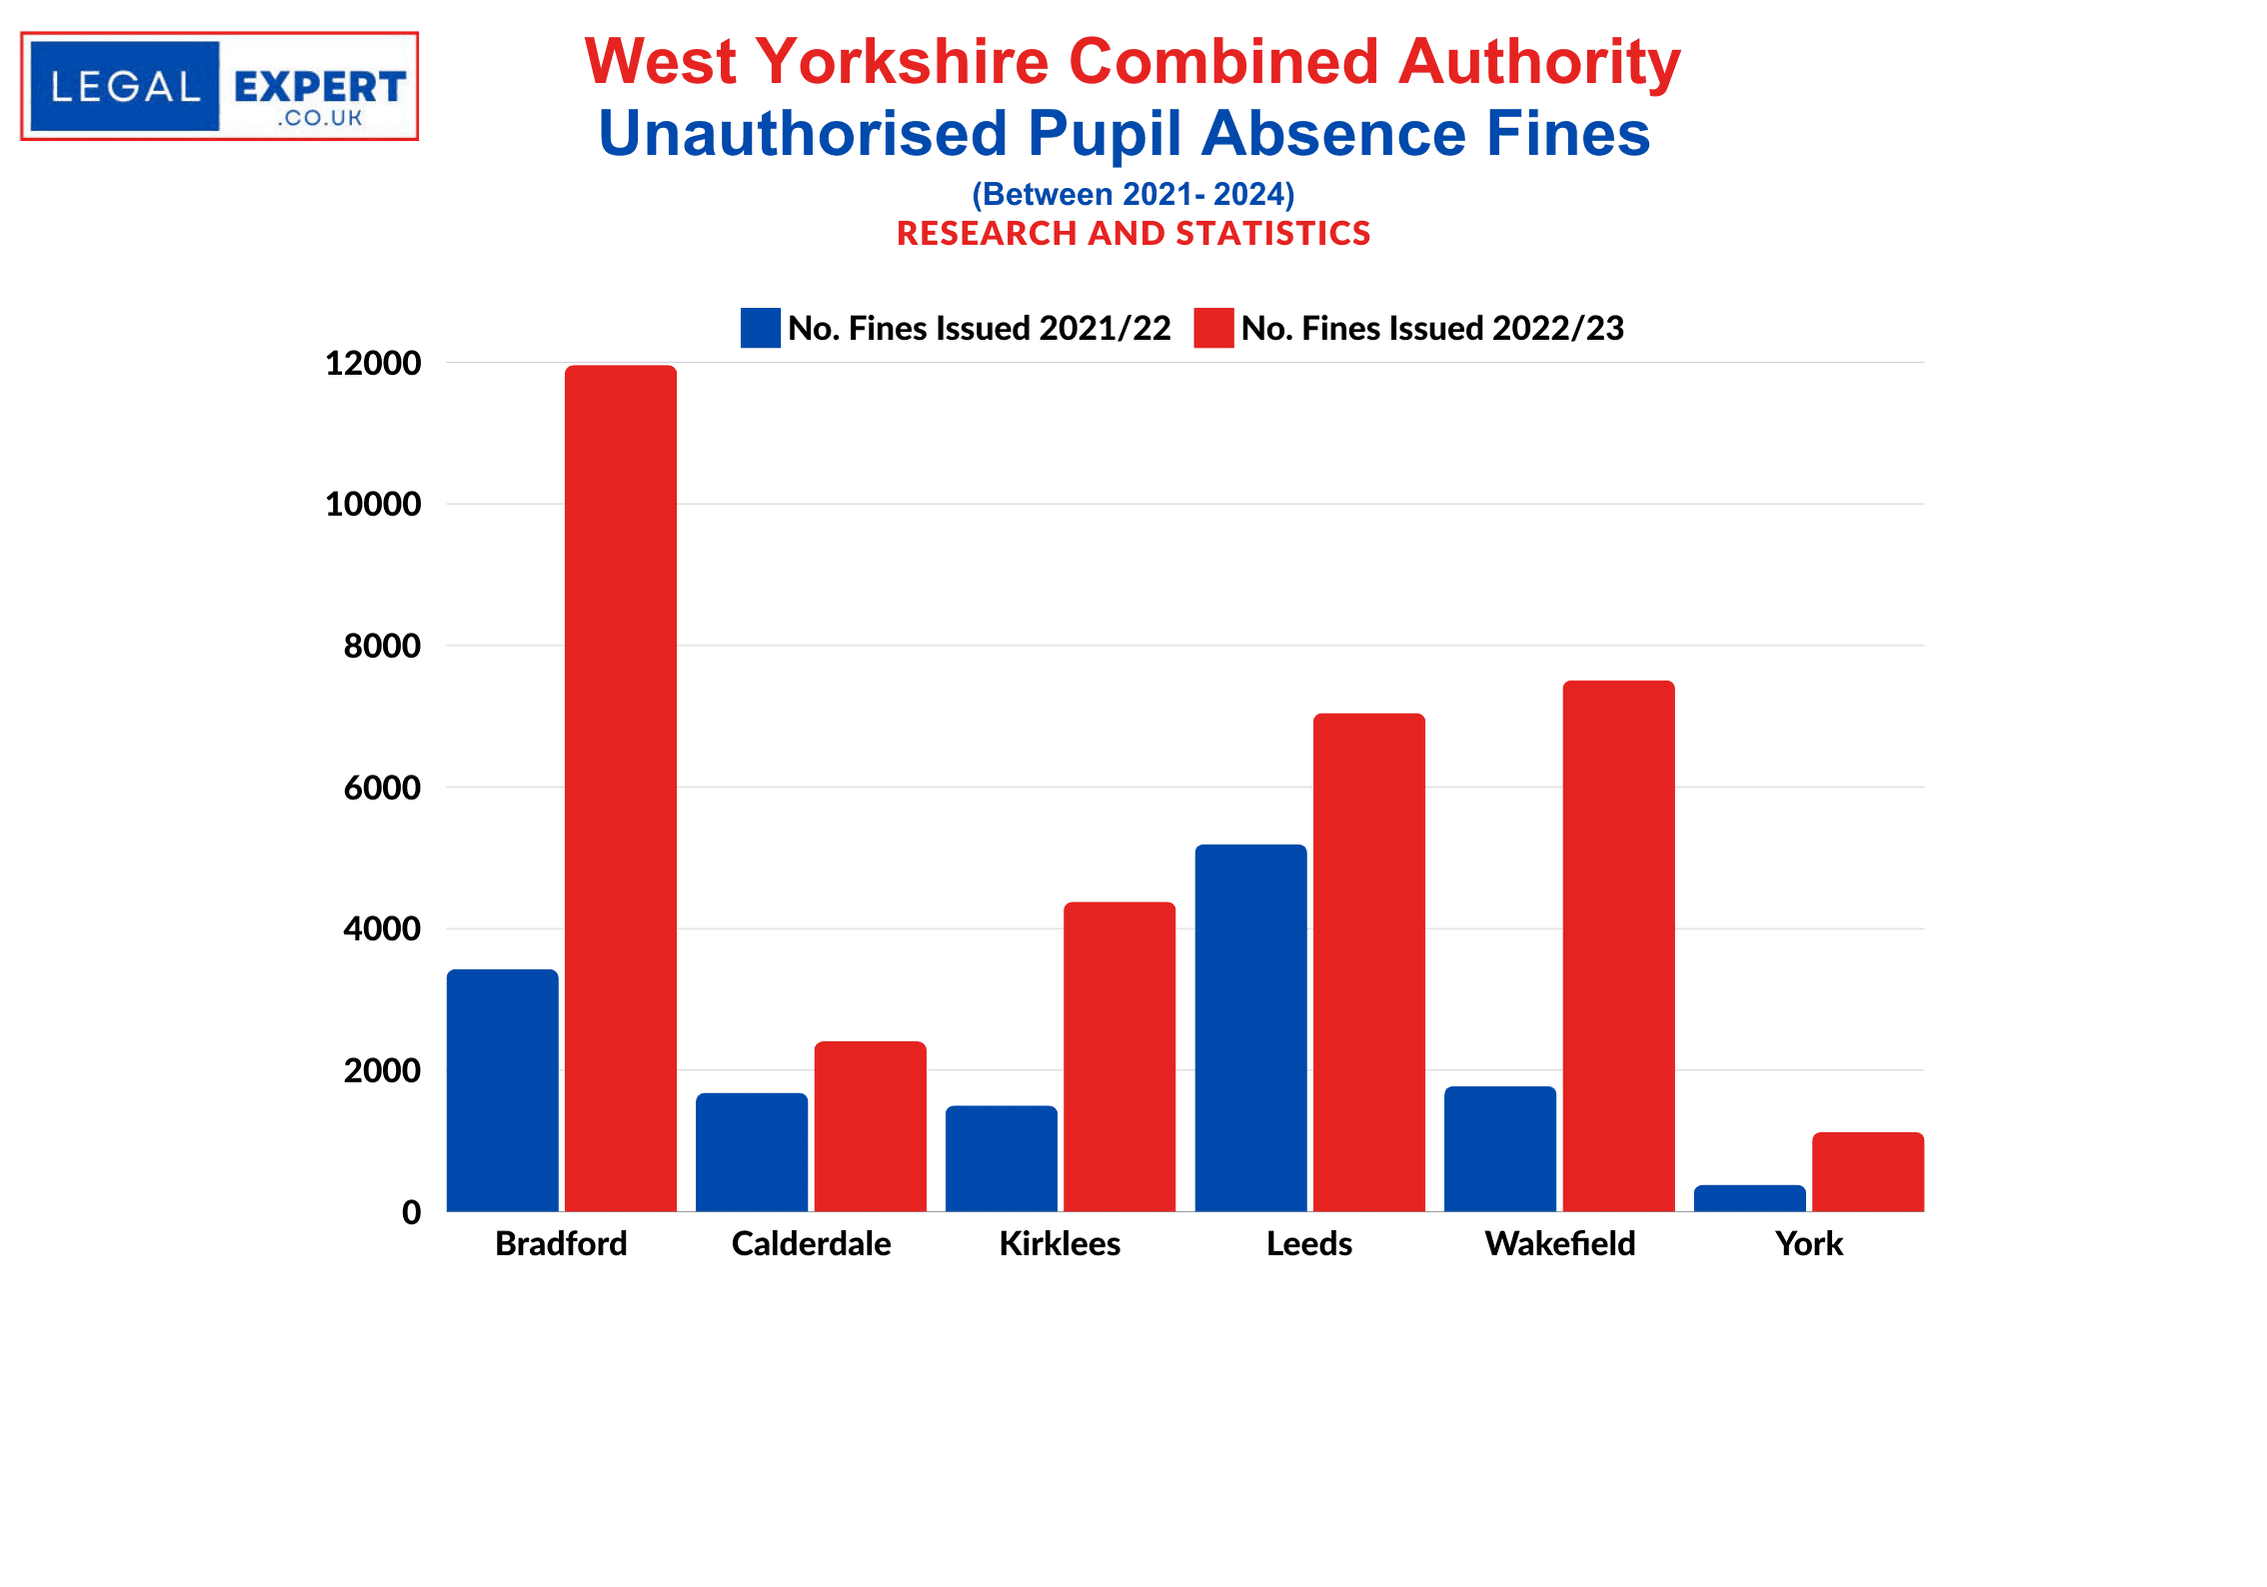
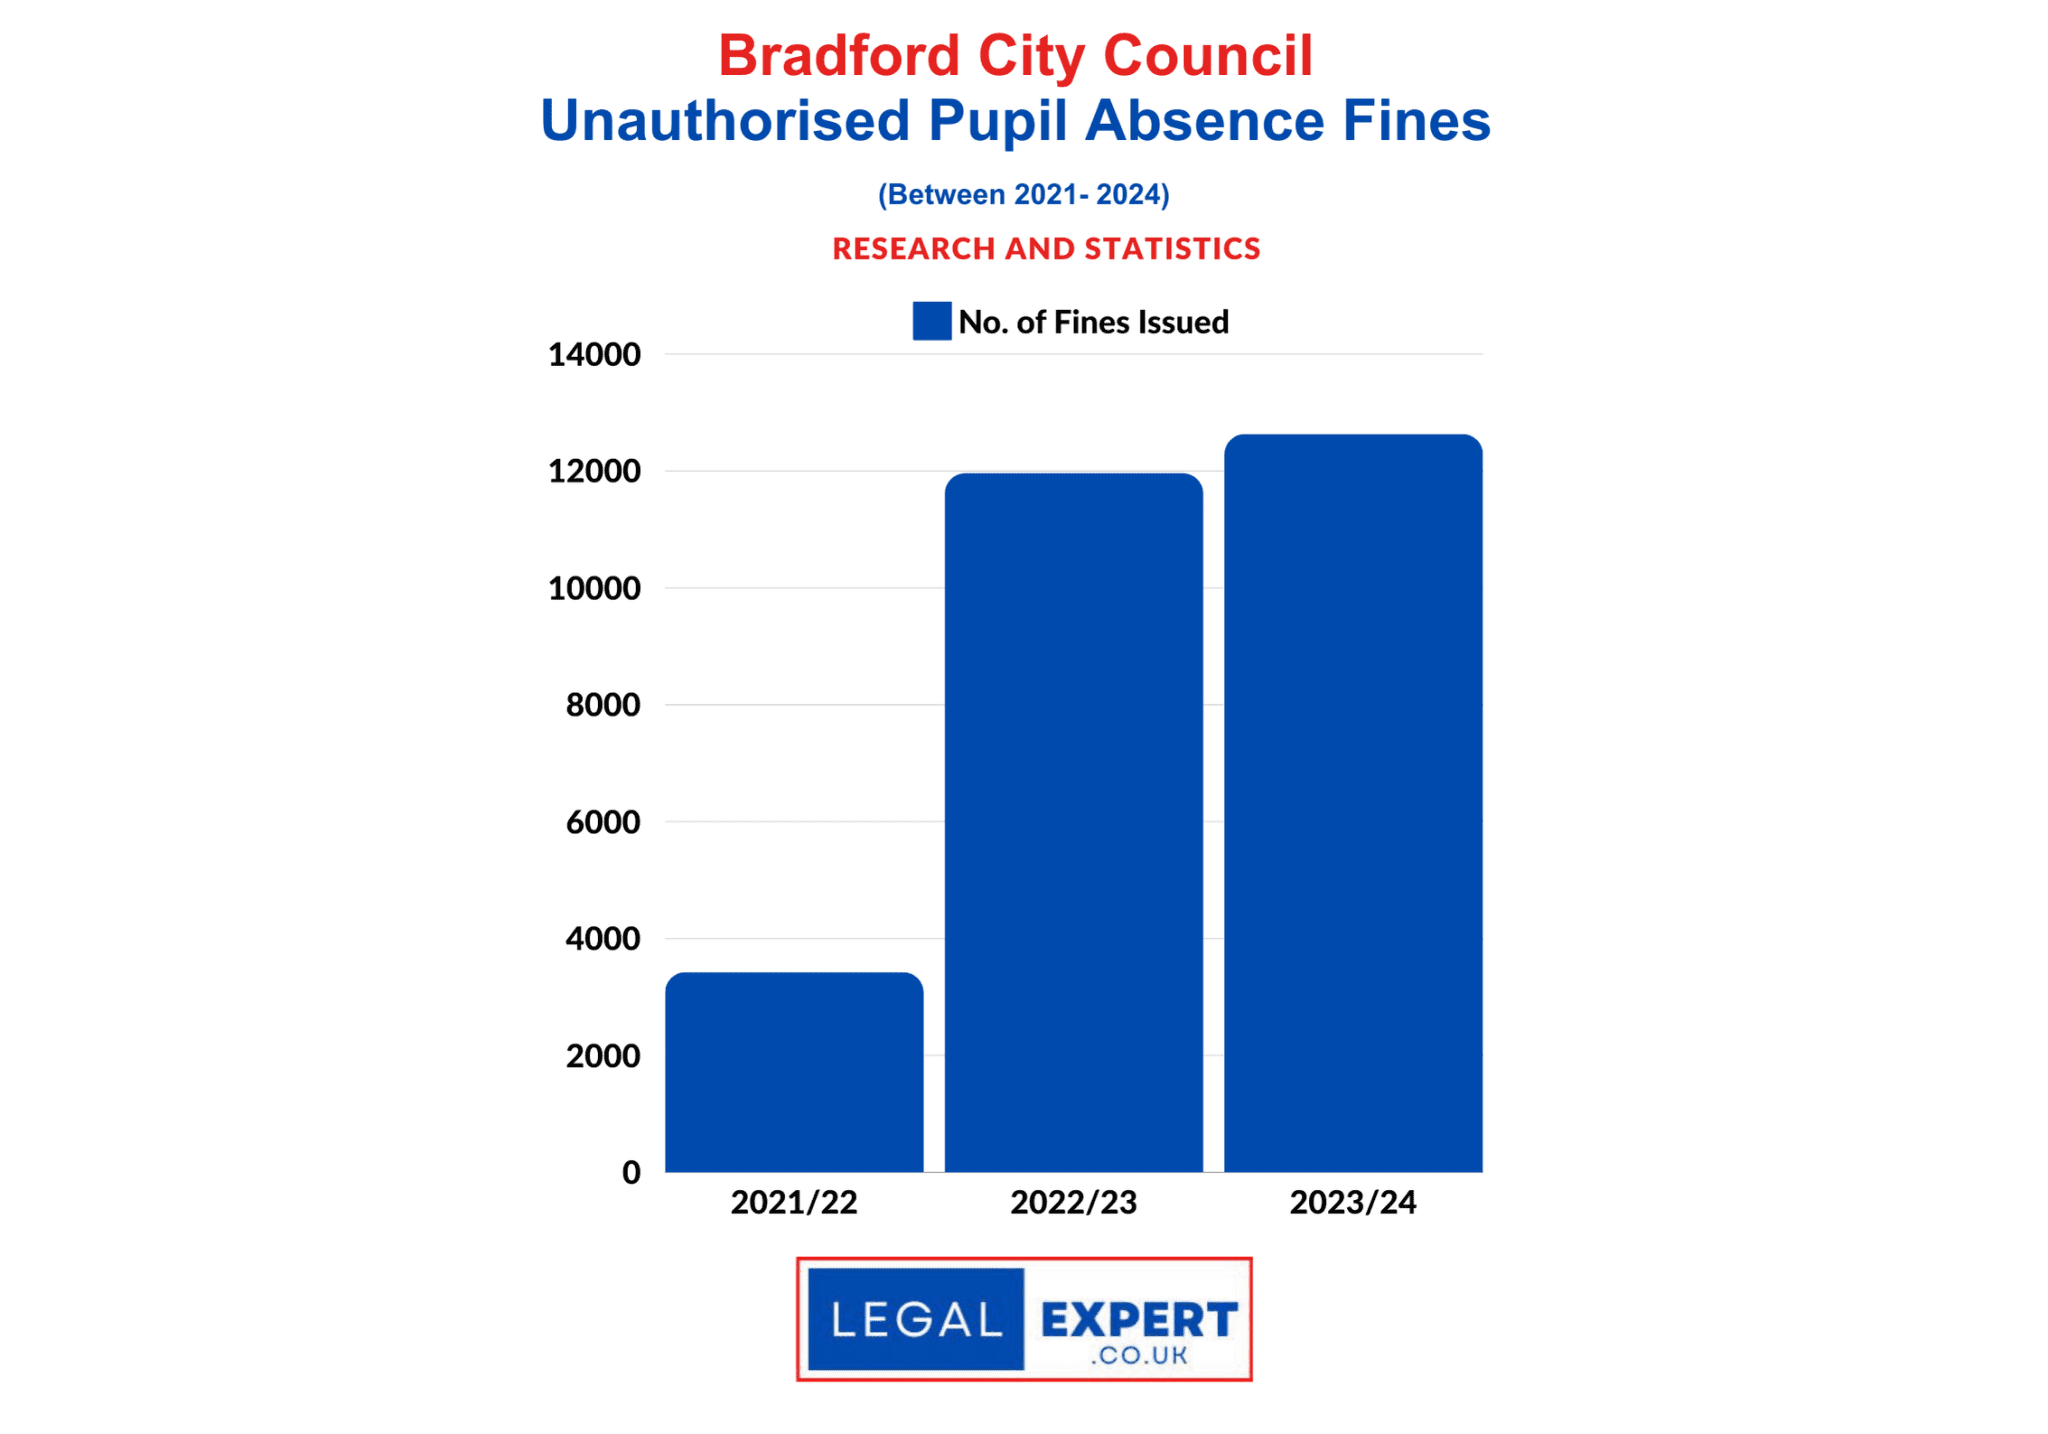
Elsewhere in West Yorkshire, 132 complaints were made about Bradford City Council. The most common issue being Education and Children’s Services.
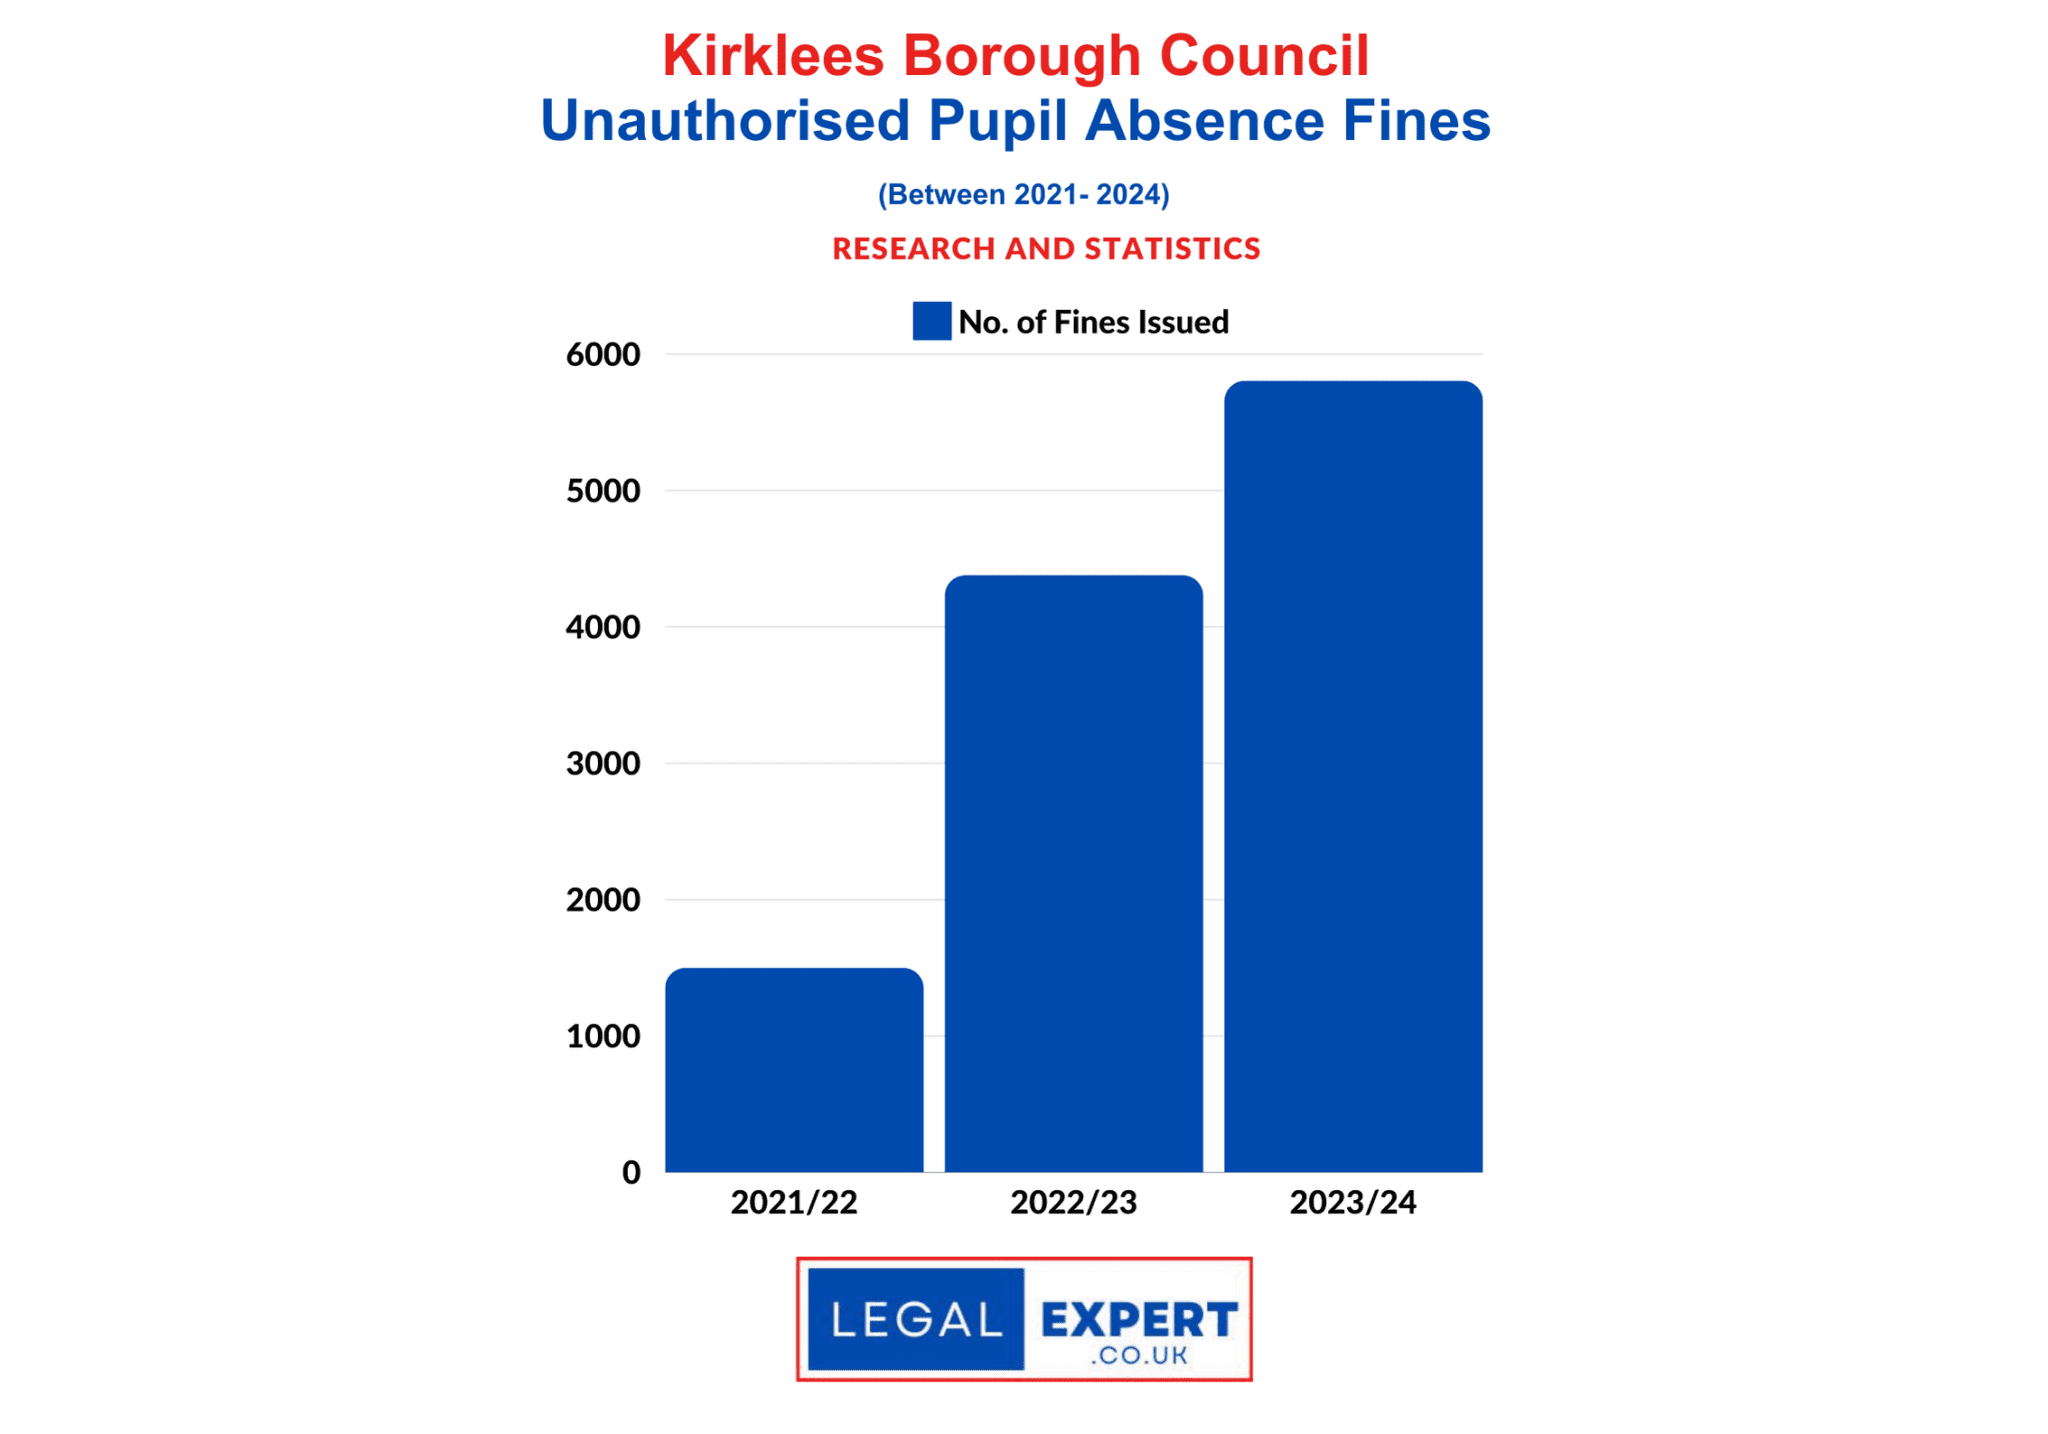
Some 96 complaints were also lodged against Kirklees Council, with Adult Social Care being the primary concern.
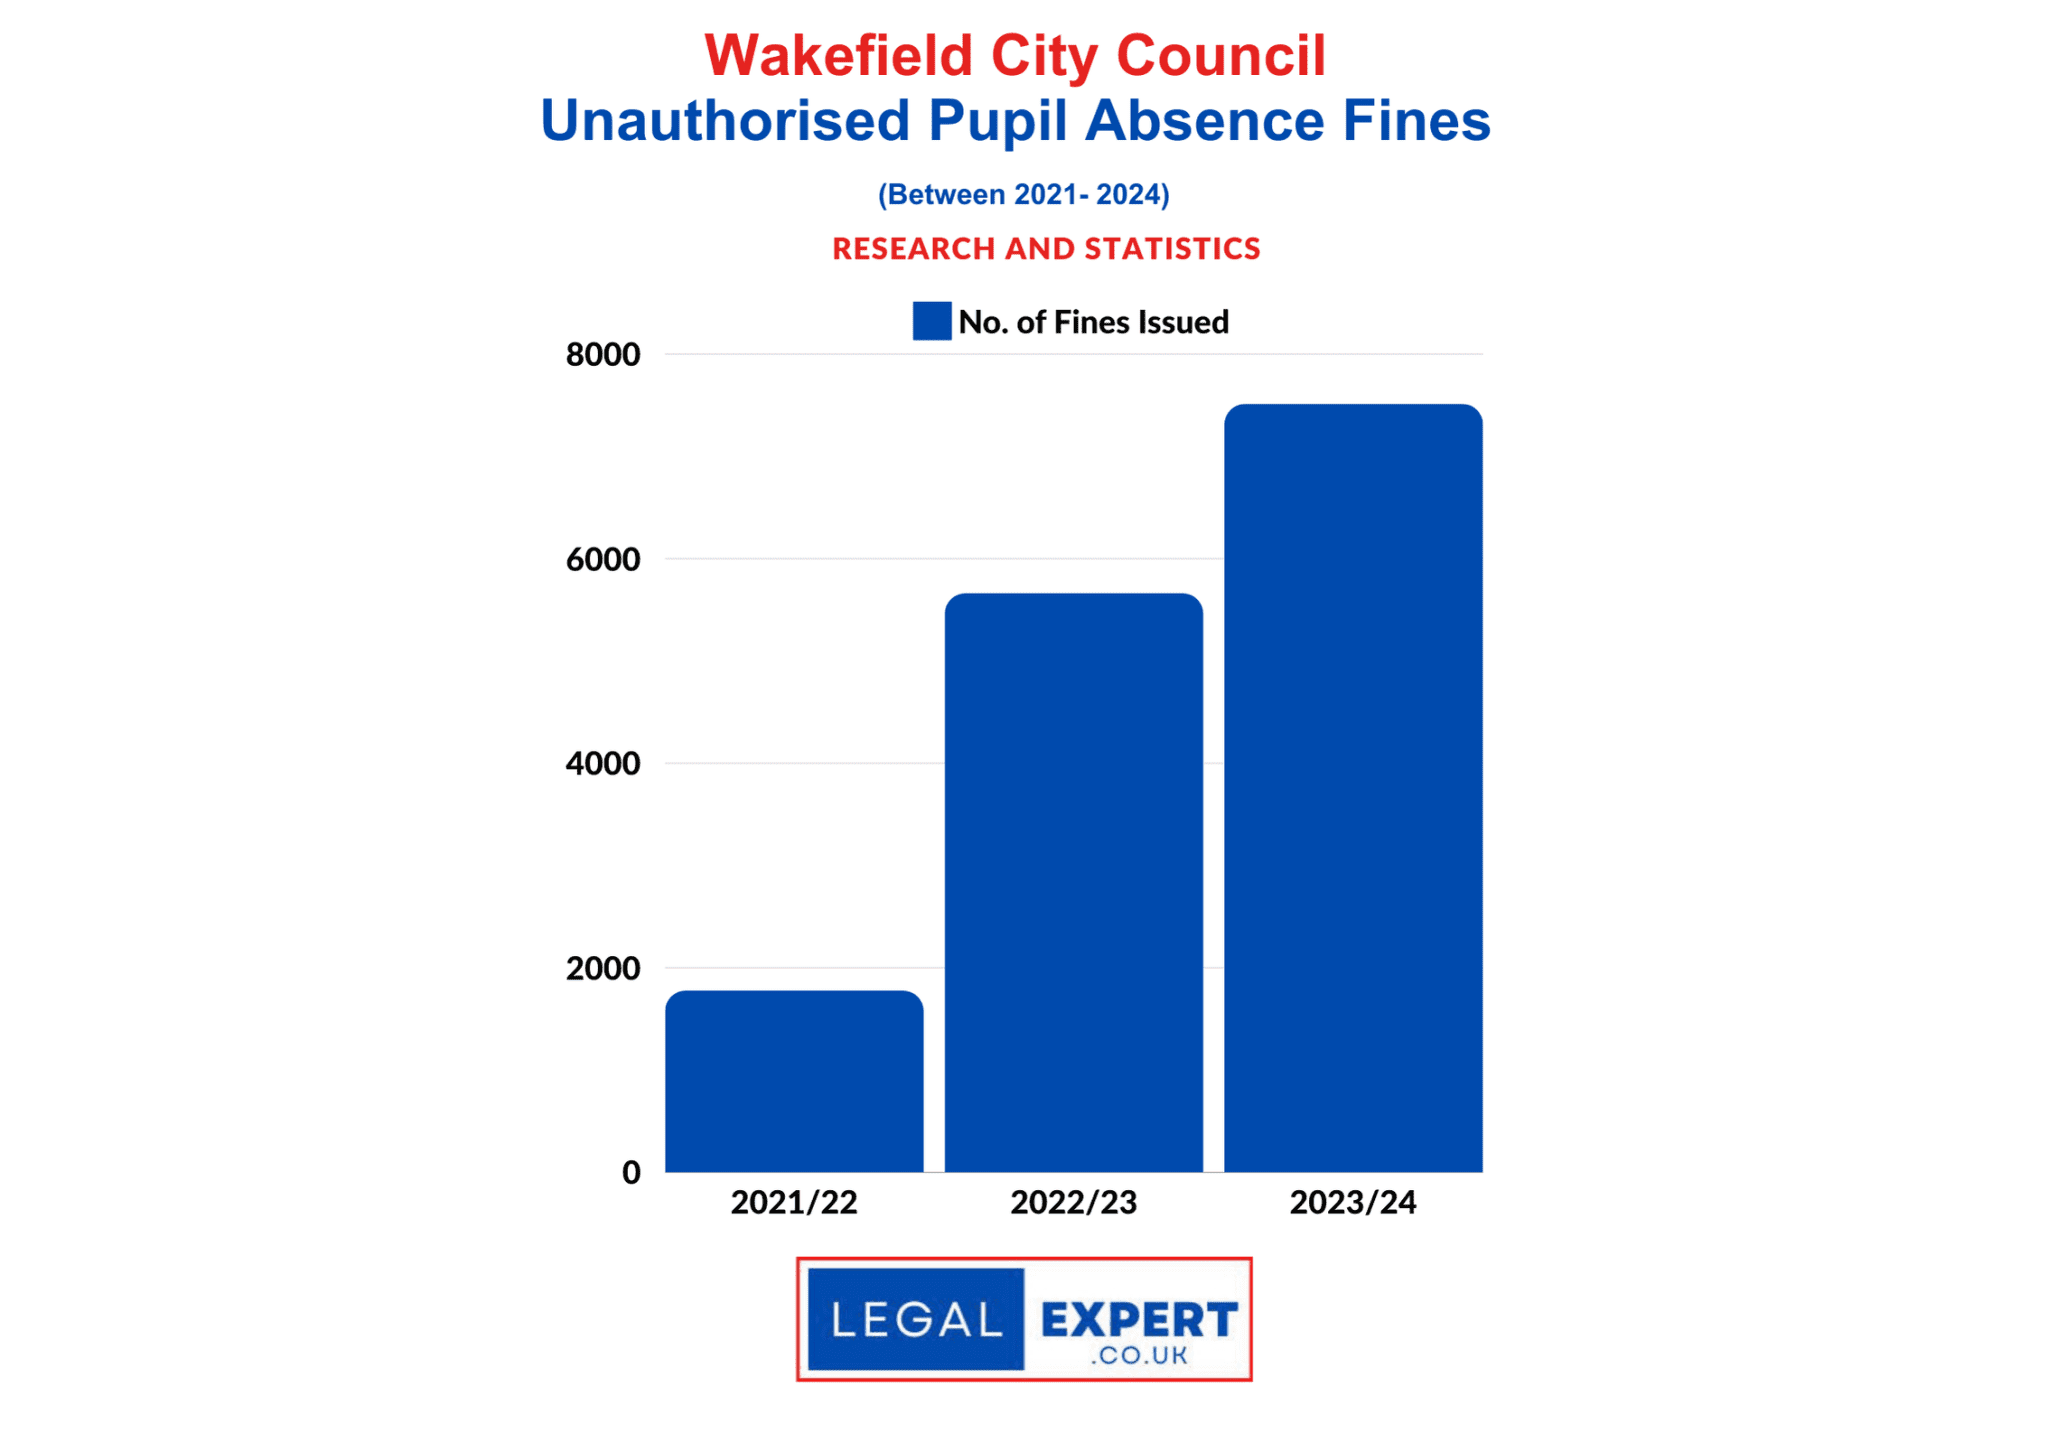
A further 86 were made for Calderdale Council as well as 61 for Wakefield. Education and Children’s Service was the most complained about sector for both.
Manchester City Council
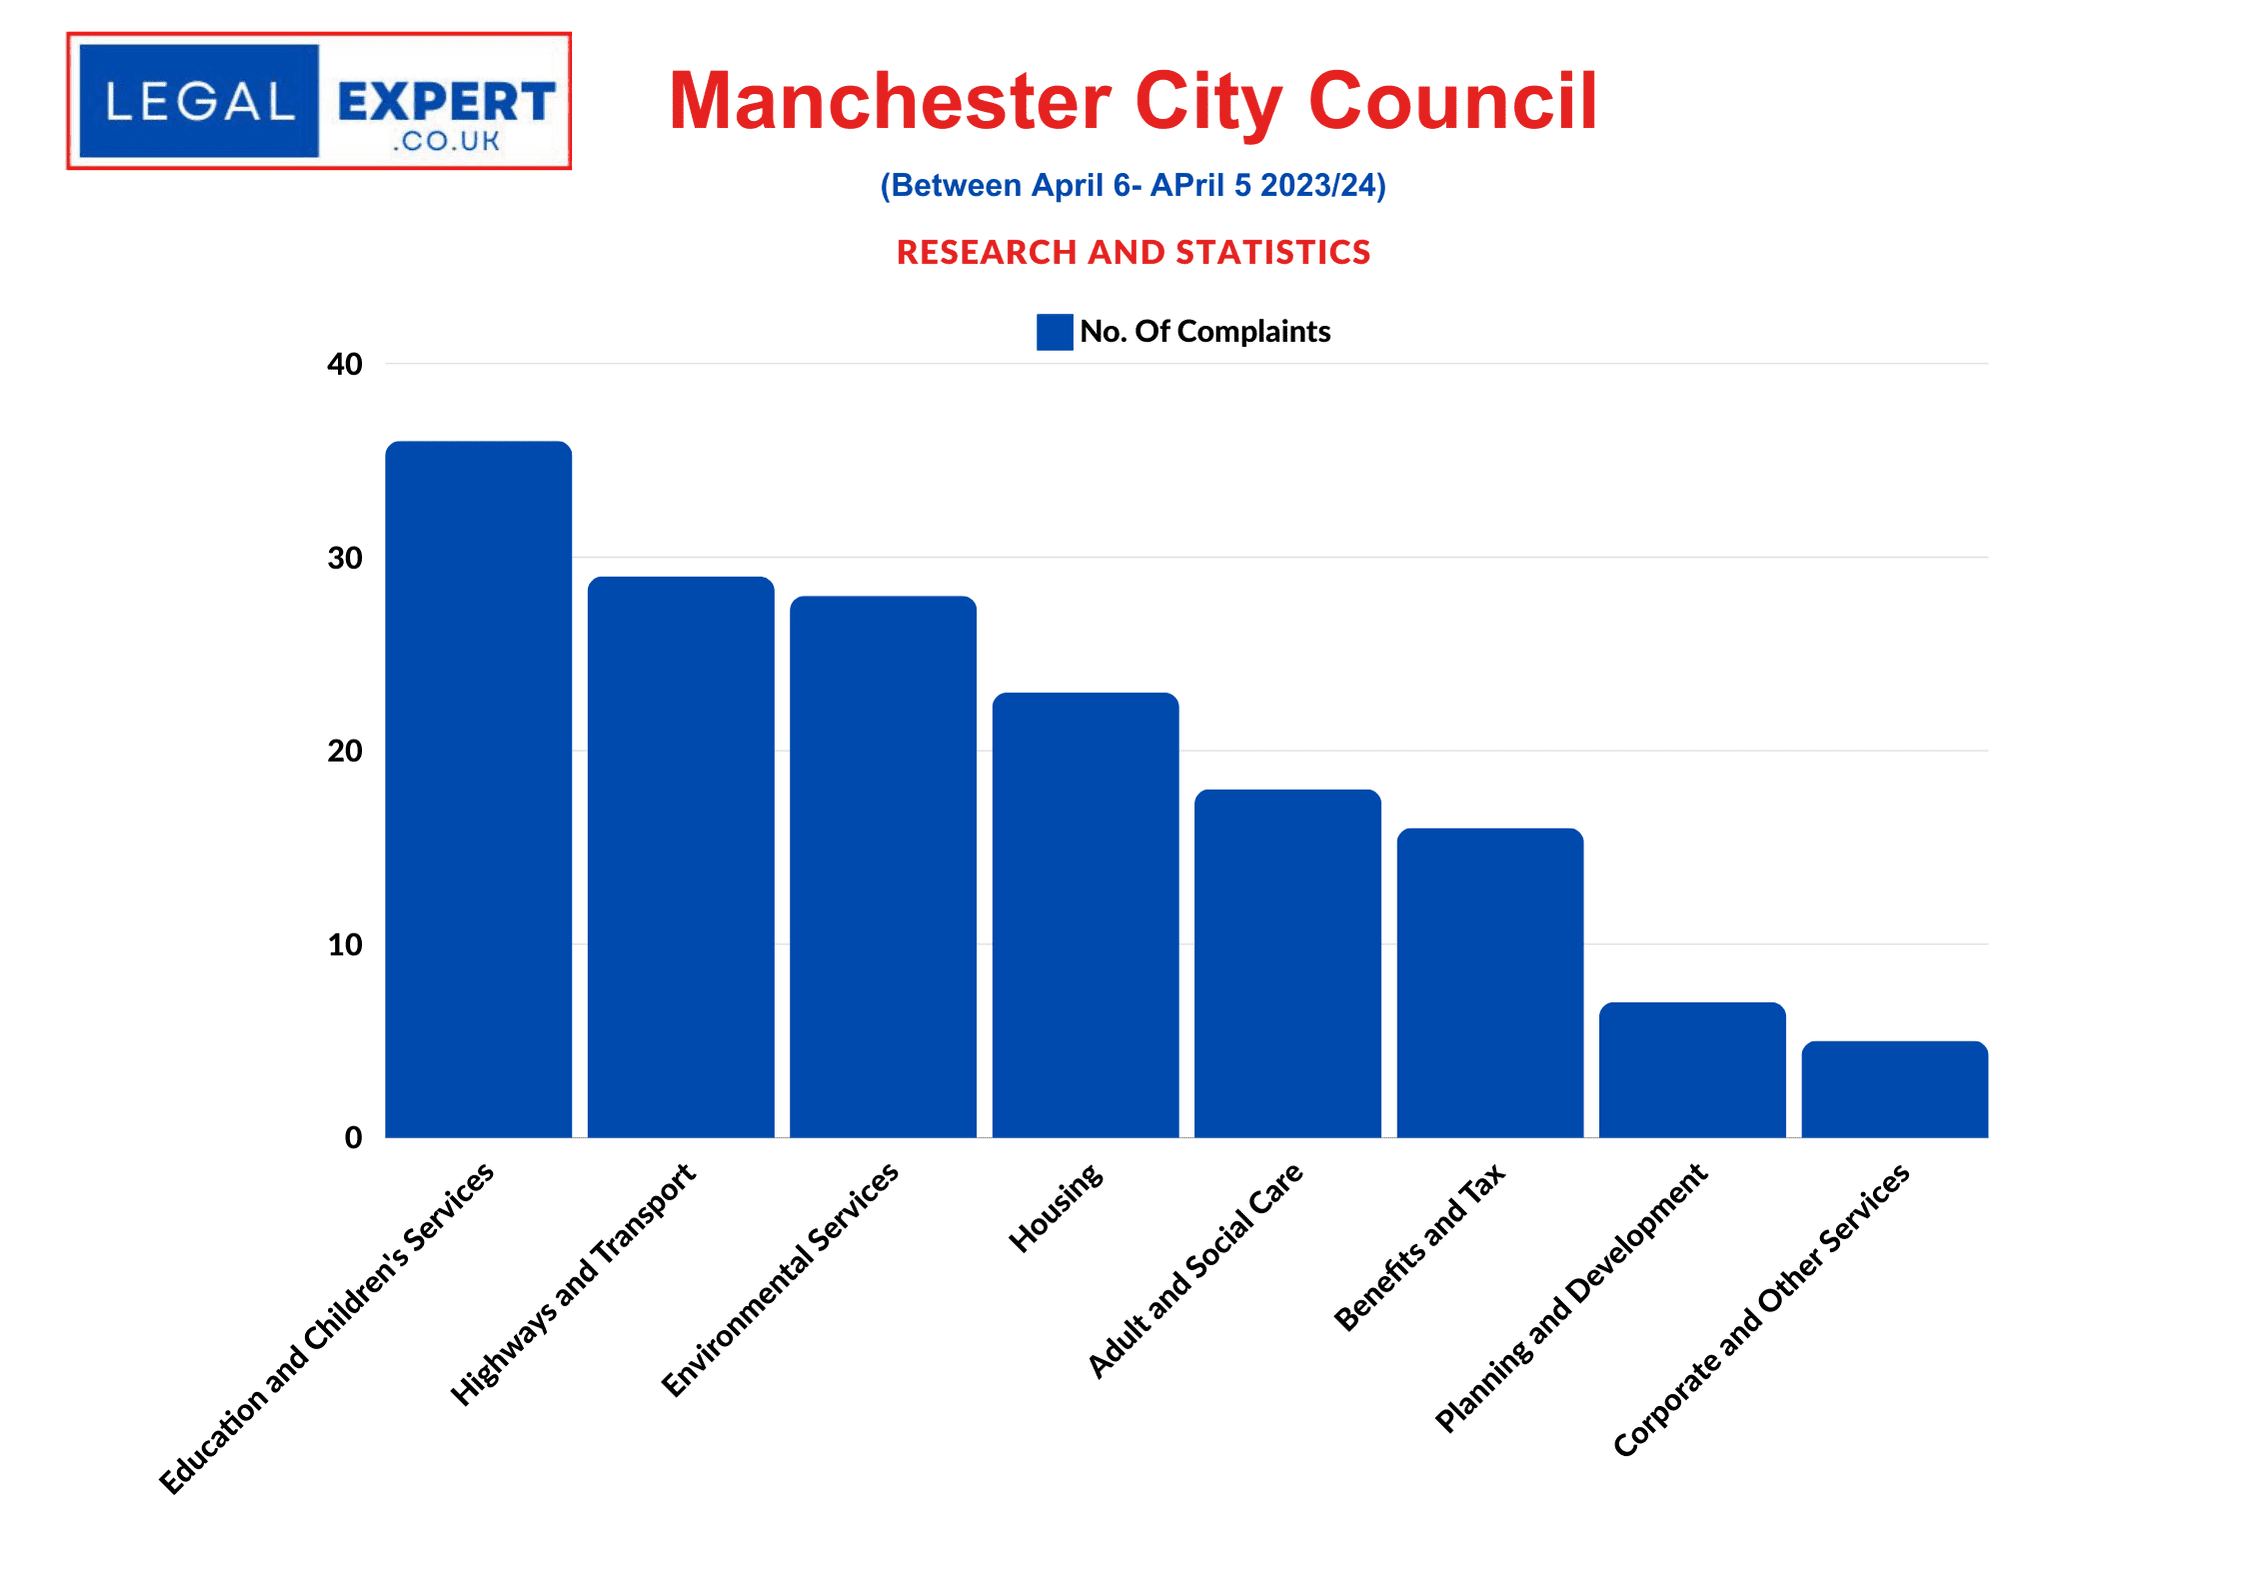
Council Complaints – Manchester City Council
Complaints by Sector
Adult and Social Care | 18
Benefits and Tax | 16
Corporate and Other Services | 5
Education and Children’s Services | 36
Environmental Services, Public Protection and Regulation | 28
Highways and Transport | 29
Housing | 23
Planning and Development | 7
Other | 1
Total No. of complaints: 163
Sheffield City Council
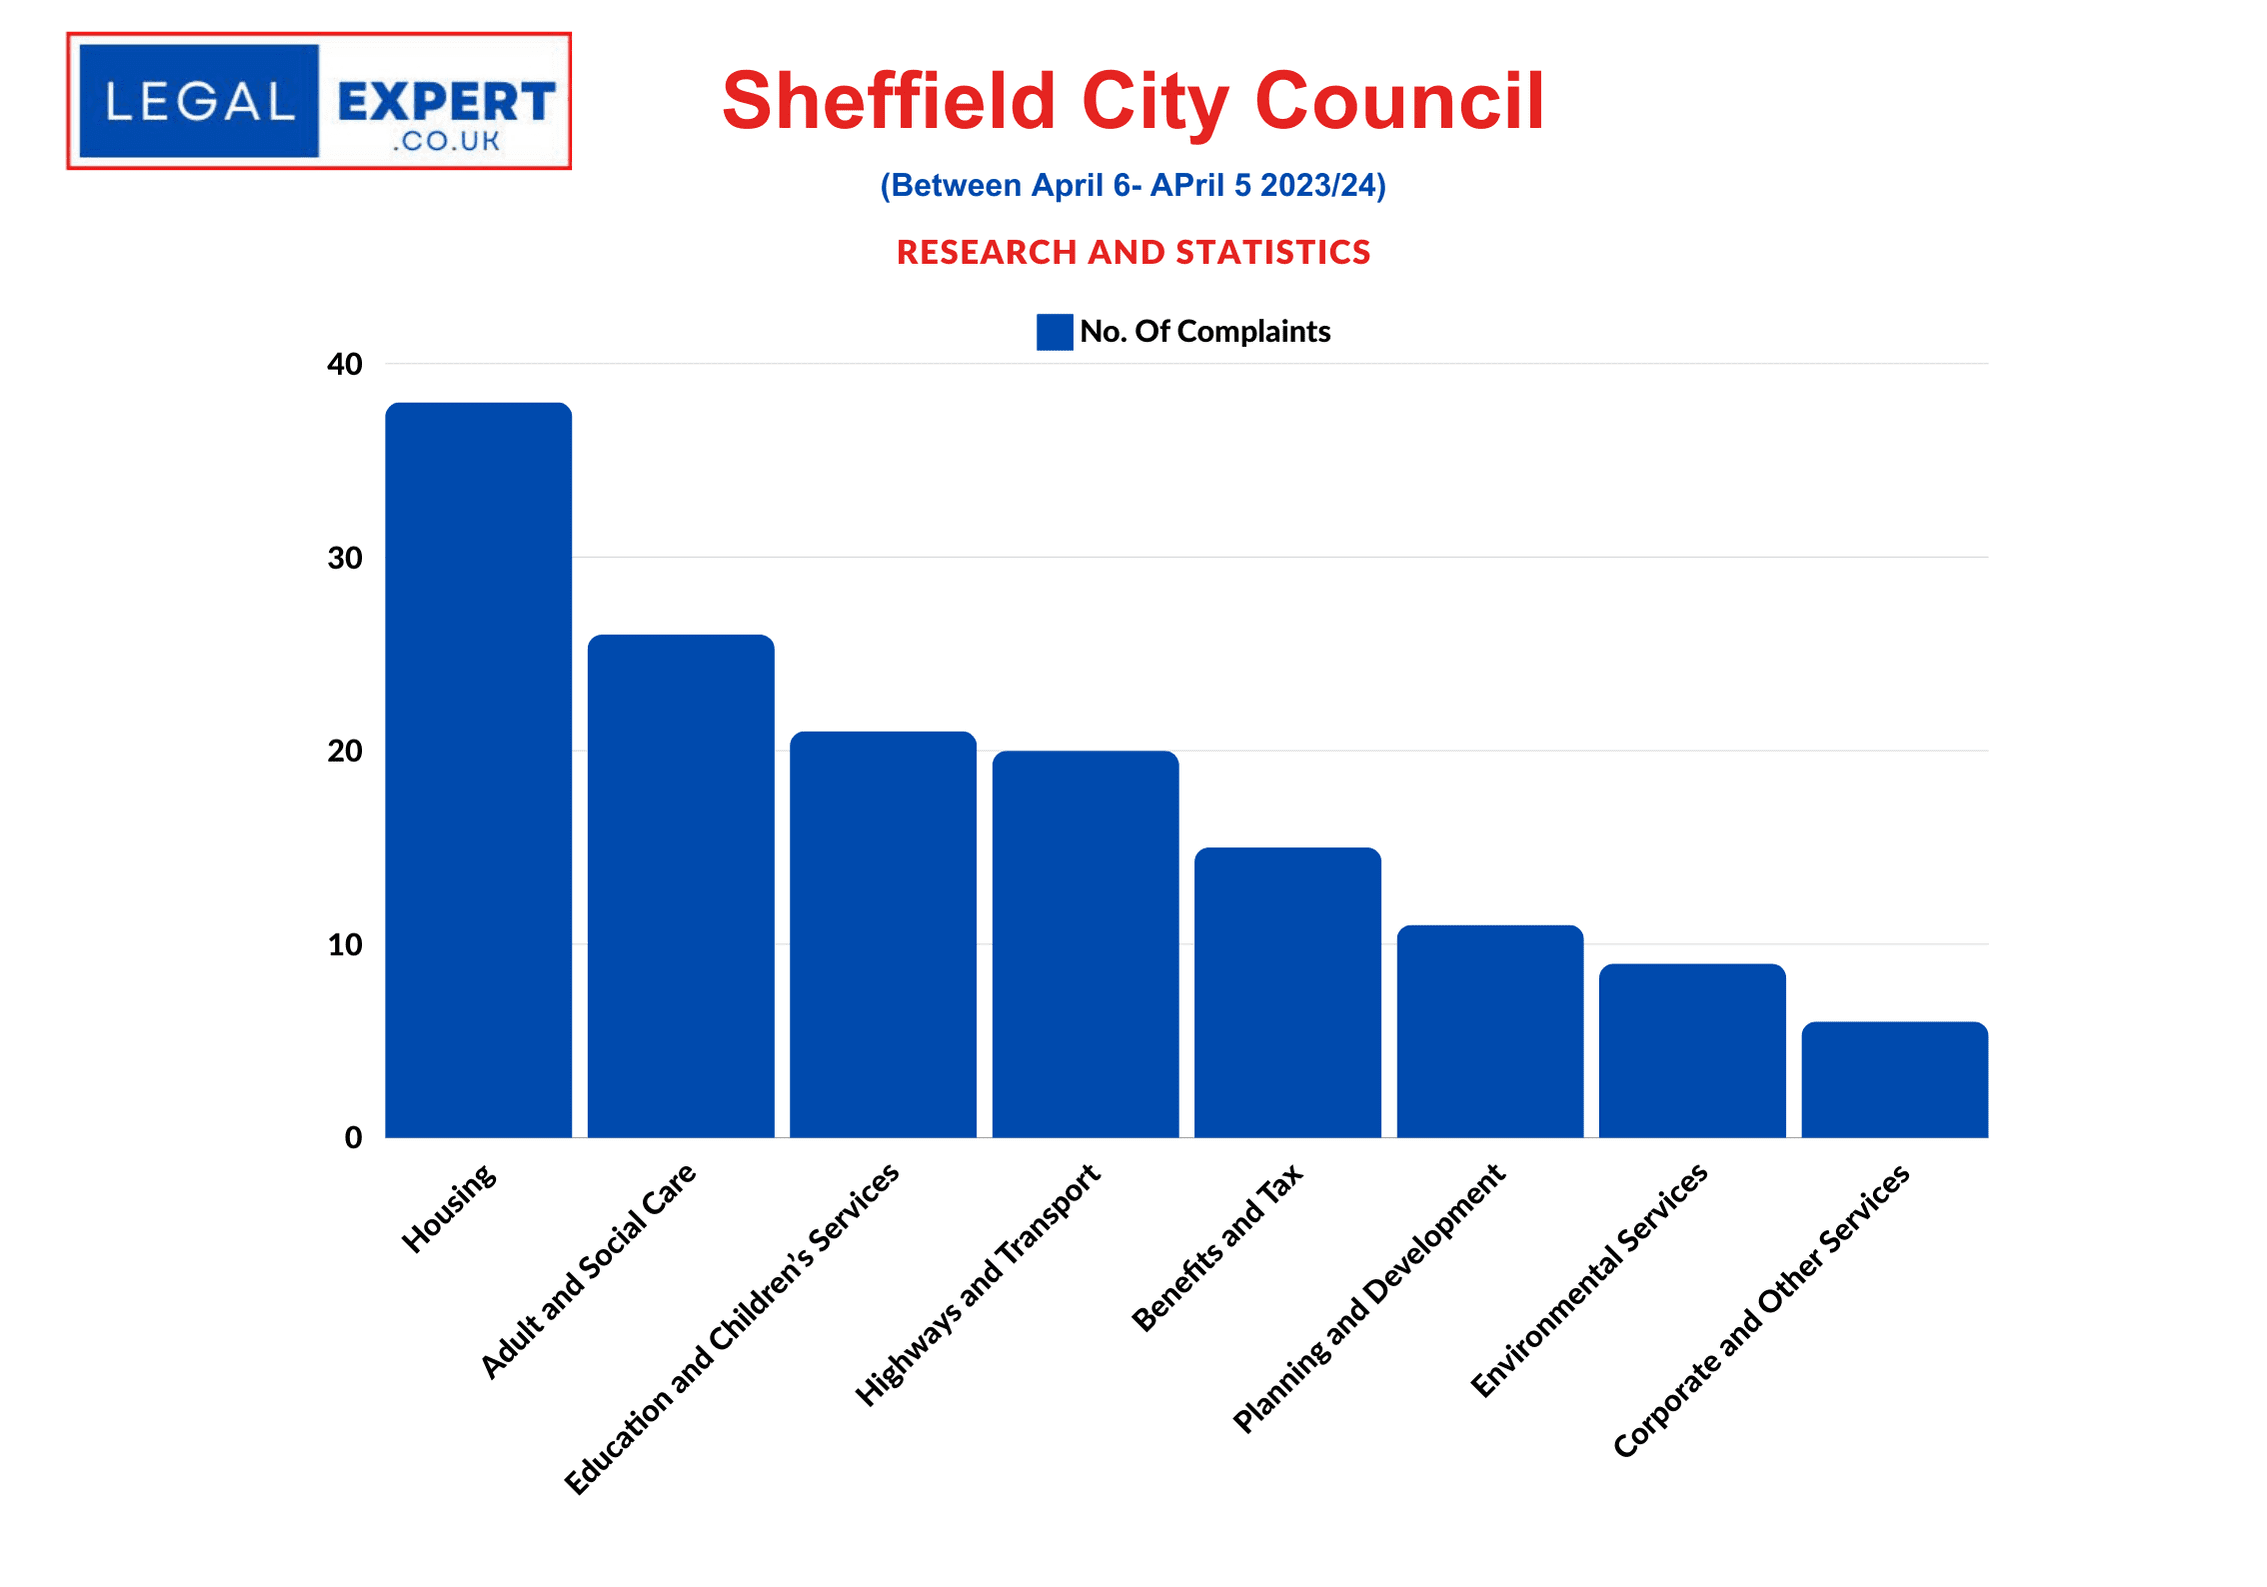
Council Complaints – Sheffield City Council
Complaints by Sector
Adult and Social Care | 26
Benefits and Tax | 15
Corporate and Other Services | 6
Education and Children’s Services | 21
Environmental Services, Public Protection and Regulation | 9
Highways and Transport | 20
Housing | 38
Planning and Development | 11
Other | 3
Total No. of complaints: 149
Bradford City Council
Complaints by Sector
Adult and Social Care | 28
Benefits and Tax | 12
Corporate and Other Services | 1
Education and Children’s Services | 36
Environmental Services, Public Protection and Regulation | 5
Highways and Transport | 27
Housing | 3
Planning and Development | 20
Other | 0
Total No. of complaints: 132
Liverpool City Council
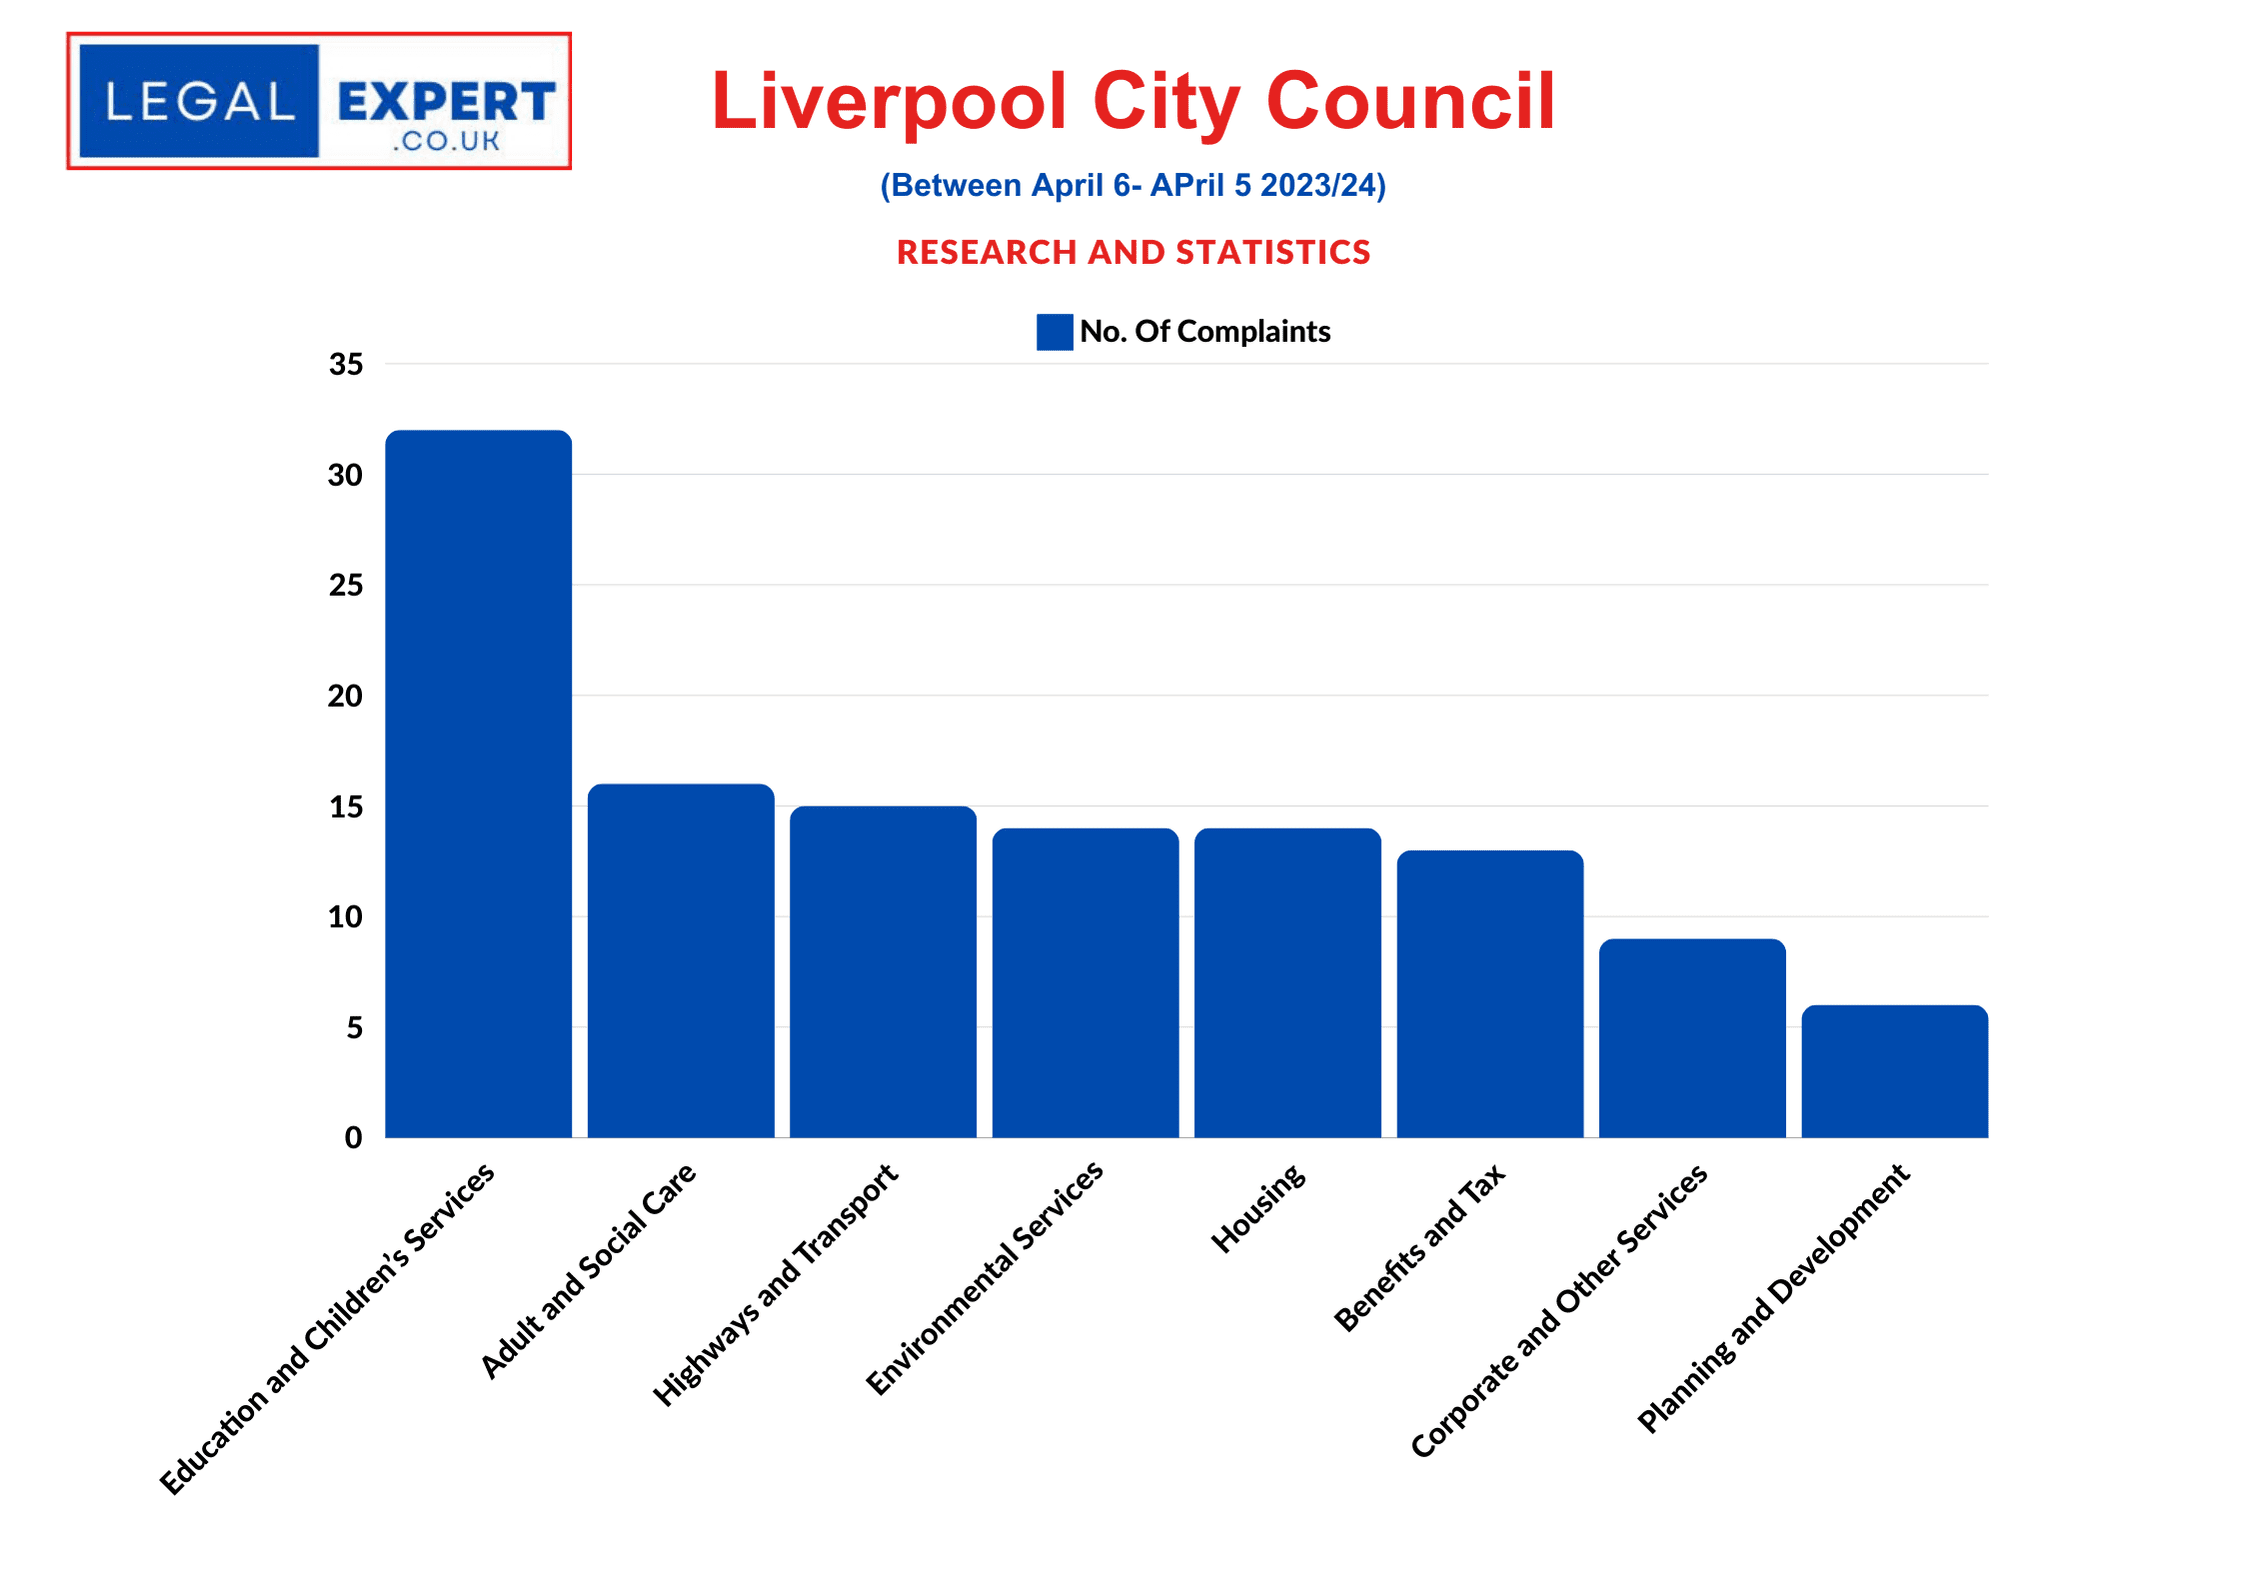
Council Complaints – Liverpool City Council
Complaints by Sector
Adult and Social Care | 16
Benefits and Tax | 13
Corporate and Other Services | 9
Education and Children’s Services | 32
Environmental Services, Public Protection and Regulation | 14
Highways and Transport | 15
Housing | 14
Planning and Development | 6
Other | 1
Total No. of complaints:120
Kirklees Metropolitan Borough Council
Complaints by Sector
Adult and Social Care | 18
Benefits and Tax | 6
Corporate and Other Services | 5
Education and Children’s Services | 17
Environmental Services, Public Protection and Regulation | 15
Highways and Transport | 4
Housing | 14
Planning and Development | 17
Other | 0
Total No. of complaints: 96
Sandwell Metropolitan Borough Council
Complaints by Sector
Adult and Social Care | 21
Benefits and Tax | 9
Corporate and Other Services | 5
Education and Children’s Services | 19
Environmental Services, Public Protection and Regulation | 8
Highways and Transport | 5
Housing | 25
Planning and Development | 3
Other | 0
Total No. of complaints: 95
Dudley Metropolitan Borough Council
Complaints by Sector
Adult and Social Care | 9
Benefits and Tax | 9
Corporate and Other Services | 4
Education and Children’s Services | 23
Environmental Services, Public Protection and Regulation | 8
Highways and Transport | 1
Housing | 28
Planning and 10 Development |
Other | 0
Total No. of complaints: 92
Calderdale Metropolitan Borough Council
Complaints by Sector
Adult and Social Care | 13
Benefits and Tax | 9
Corporate and Other Services | 4
Education and Children’s Services | 20
Environmental Services, Public Protection and Regulation | 11
Highways and Transport | 10
Housing | 7
Planning and Development | 12
Other | 0
Total No. of complaints: 86
Wirral Metropolitan Borough Council
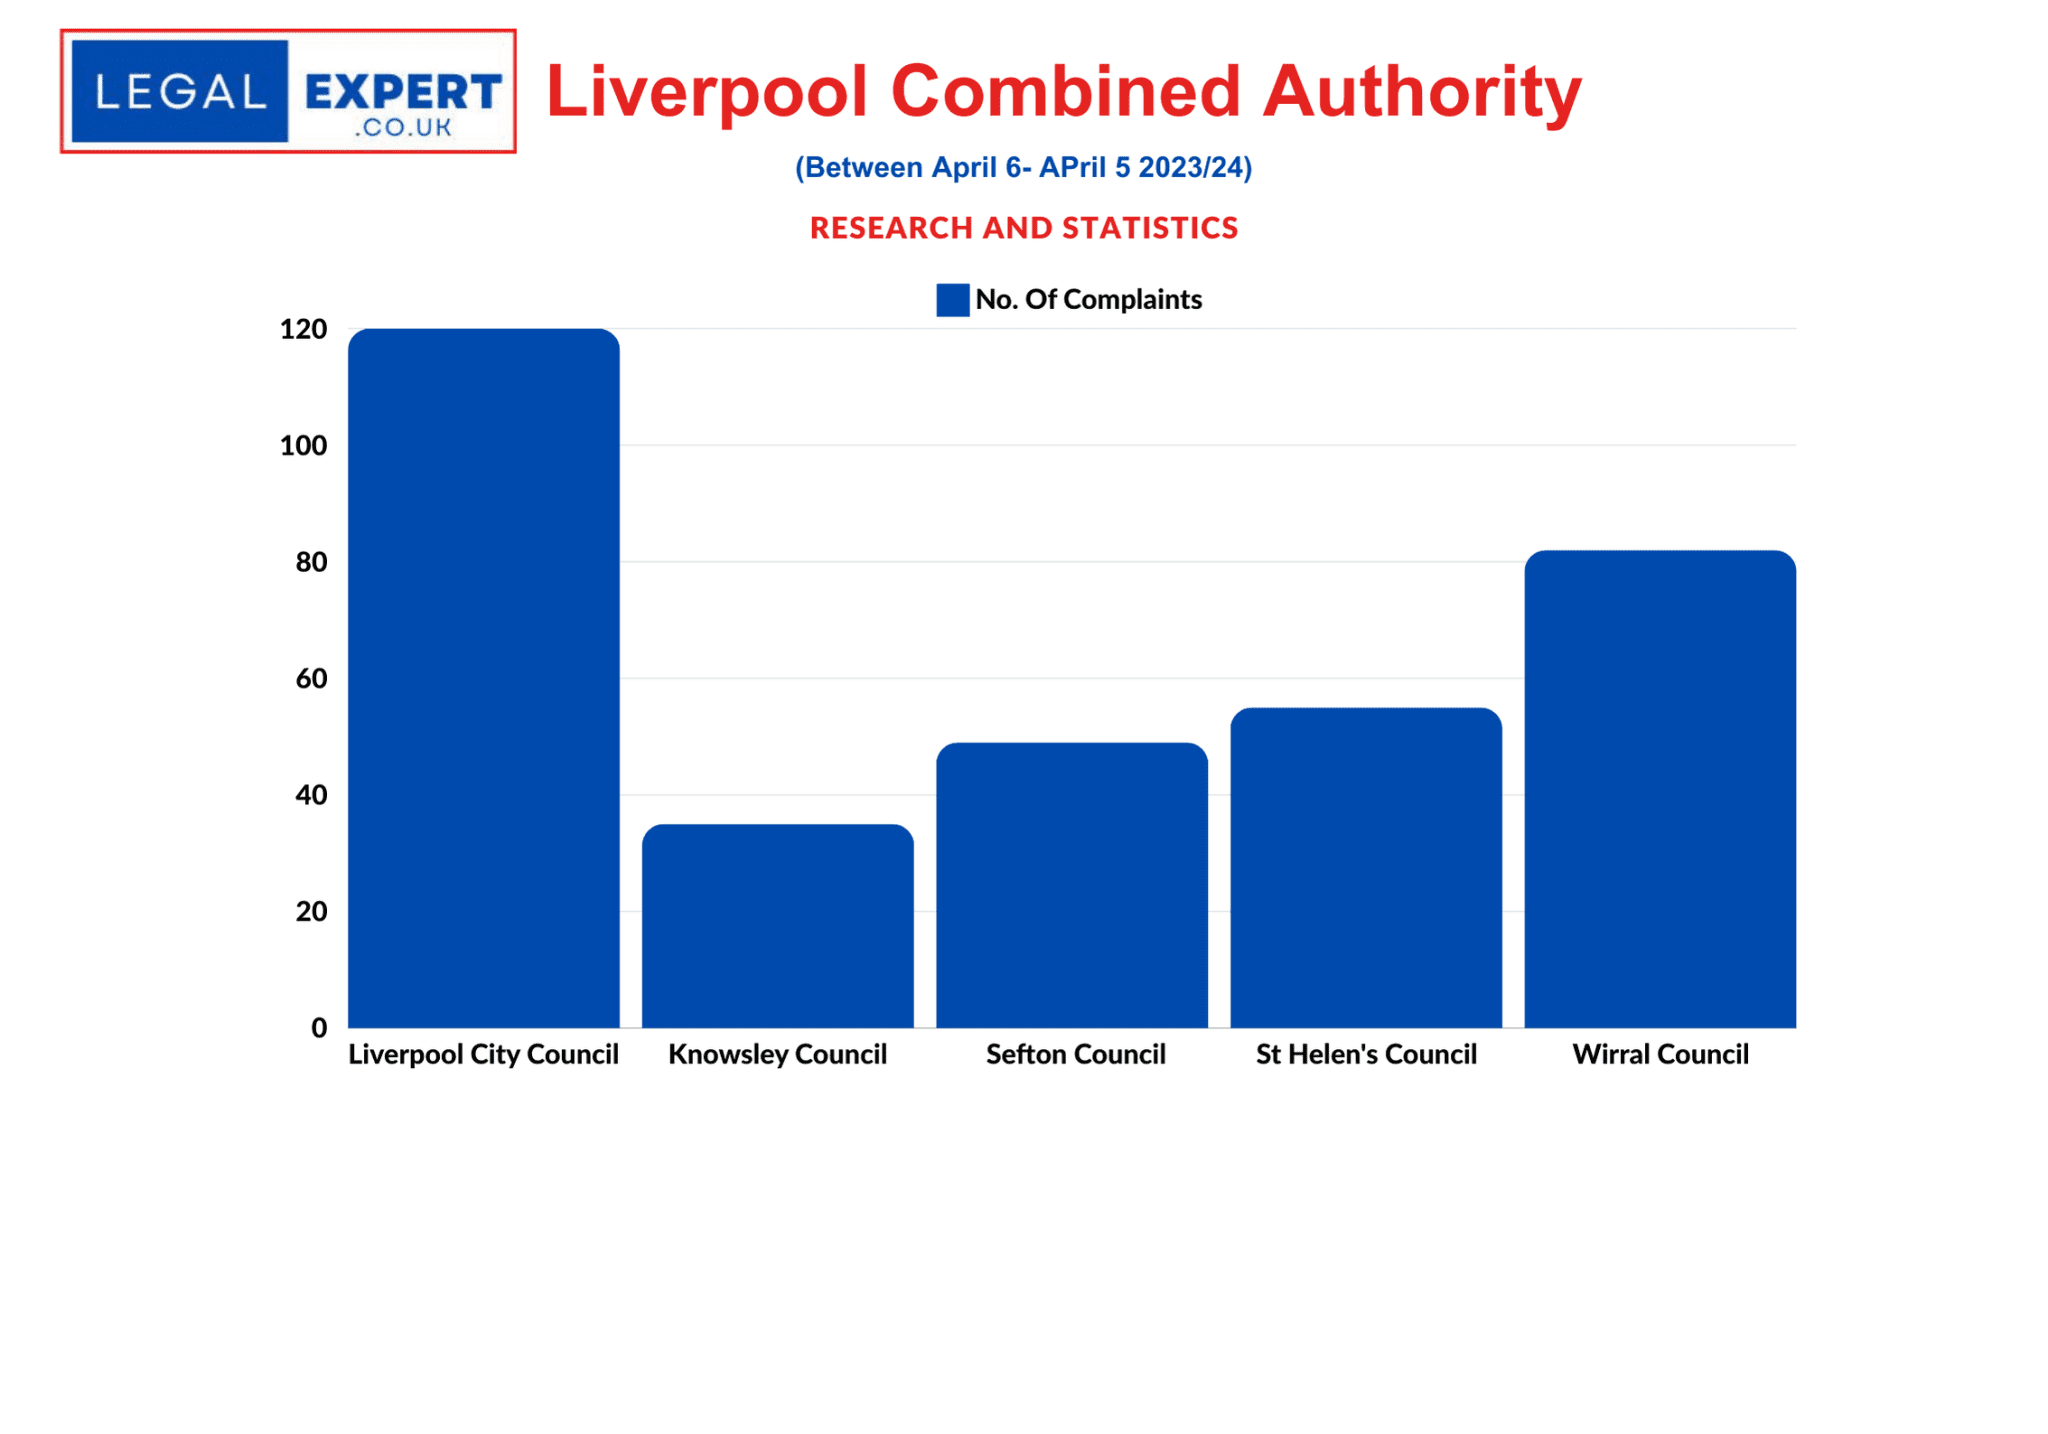
Council Complaints – Liverpool Combined Authority
Complaints by Sector
Adult and Social Care | 14
Benefits and Tax | 6
Corporate and Other Services | 2
Education and Children’s Services | 38
Environmental Services, Public Protection and Regulation | 6
Highways and Transport | 3
Housing | 5
Planning and Development | 8
Other | 0
Total No. of complaints: 82
Bury Metropolitan Borough Council
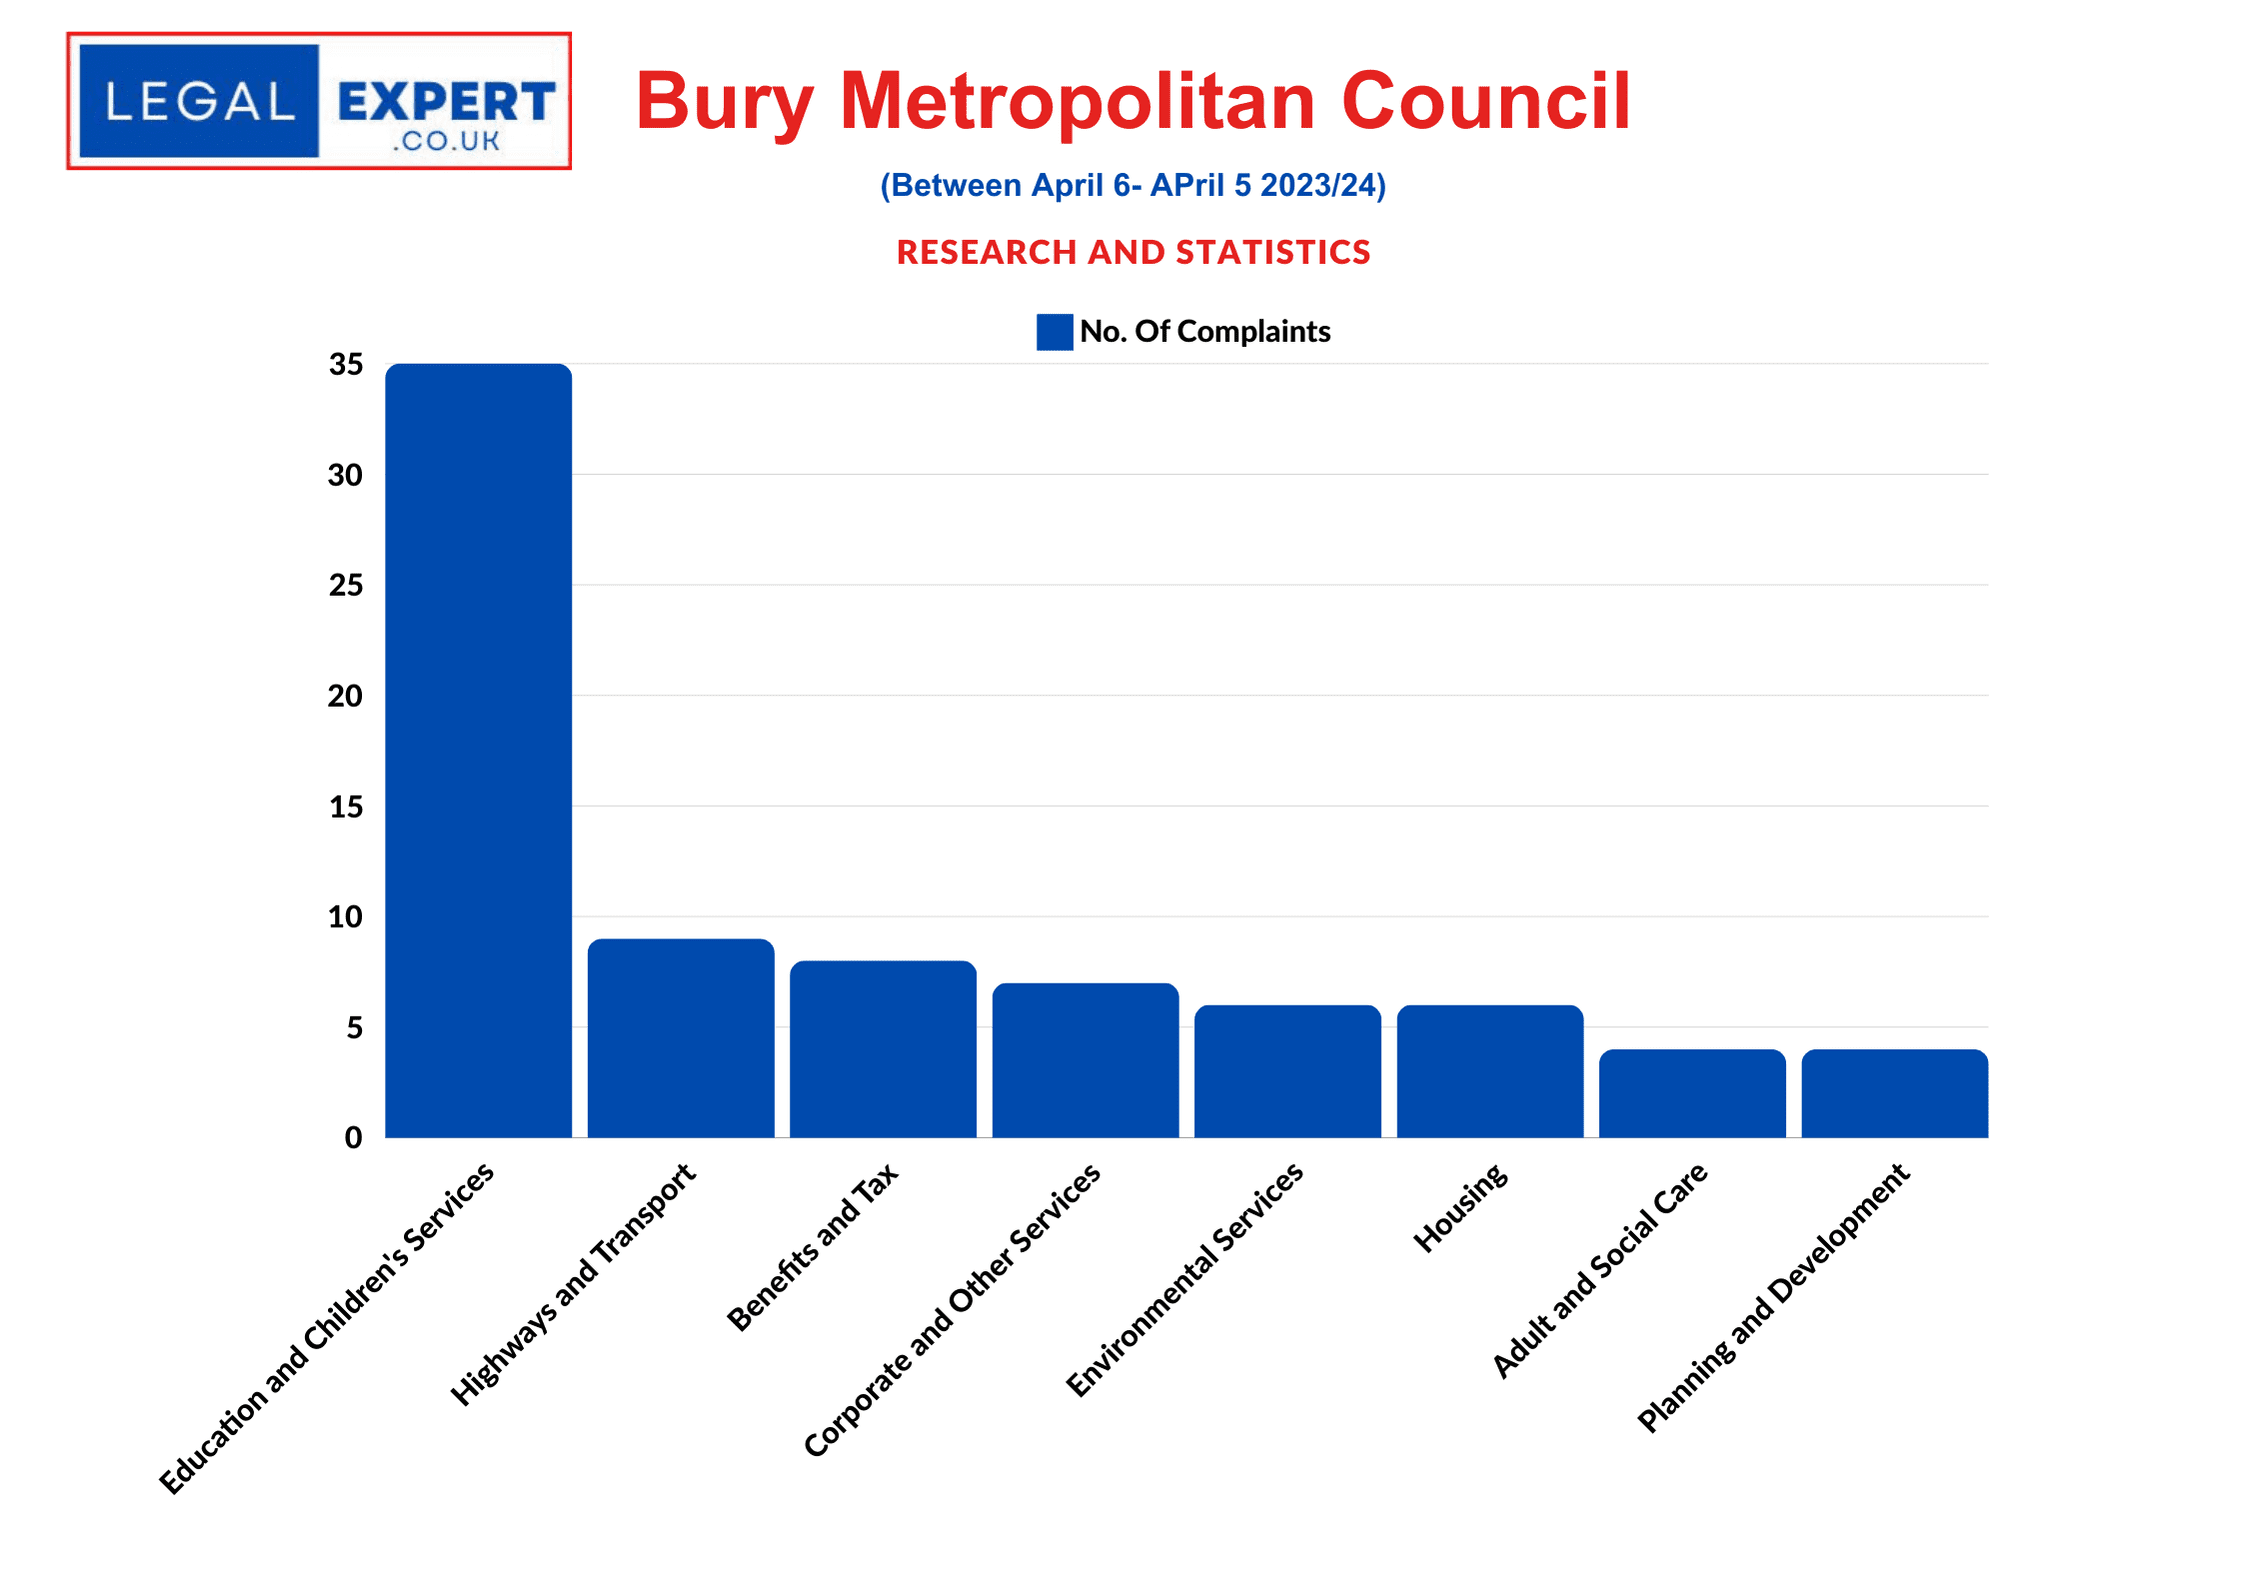
Council Complaints – Bury MB Council
Complaints by Sector
Adult and Social Care | 4
Benefits and Tax | 8
Corporate and Other Services | 7
Education and Children’s Services | 35
Environmental Services, Public Protection and Regulation | 6
Highways and Transport | 9
Housing | 6
Planning and Development | 4
Other | 1
Total No. of complaints: 80
Coventry City Council
Complaints by Sector
Adult and Social Care | 10
Benefits and Tax | 9
Corporate and Other Services | 6
Education and Children’s Services | 23
Environmental Services, Public Protection and Regulation | 5
Highways and Transport | 6
Housing | 14
Planning and Development | 4
Other | 2
Total No. of complaints: 79
Salford City Council
Complaints by Sector
Adult and Social Care | 13
Benefits and Tax | 17
Corporate and Other Services | 2
Education and Children’s Services | 22
Environmental Services, Public Protection and Regulation | 5
Highways and Transport | 6
Housing | 12
Planning and Development | 1
Other | 0
Total No. of complaints: 78
Gateshead Metropolitan Borough Council
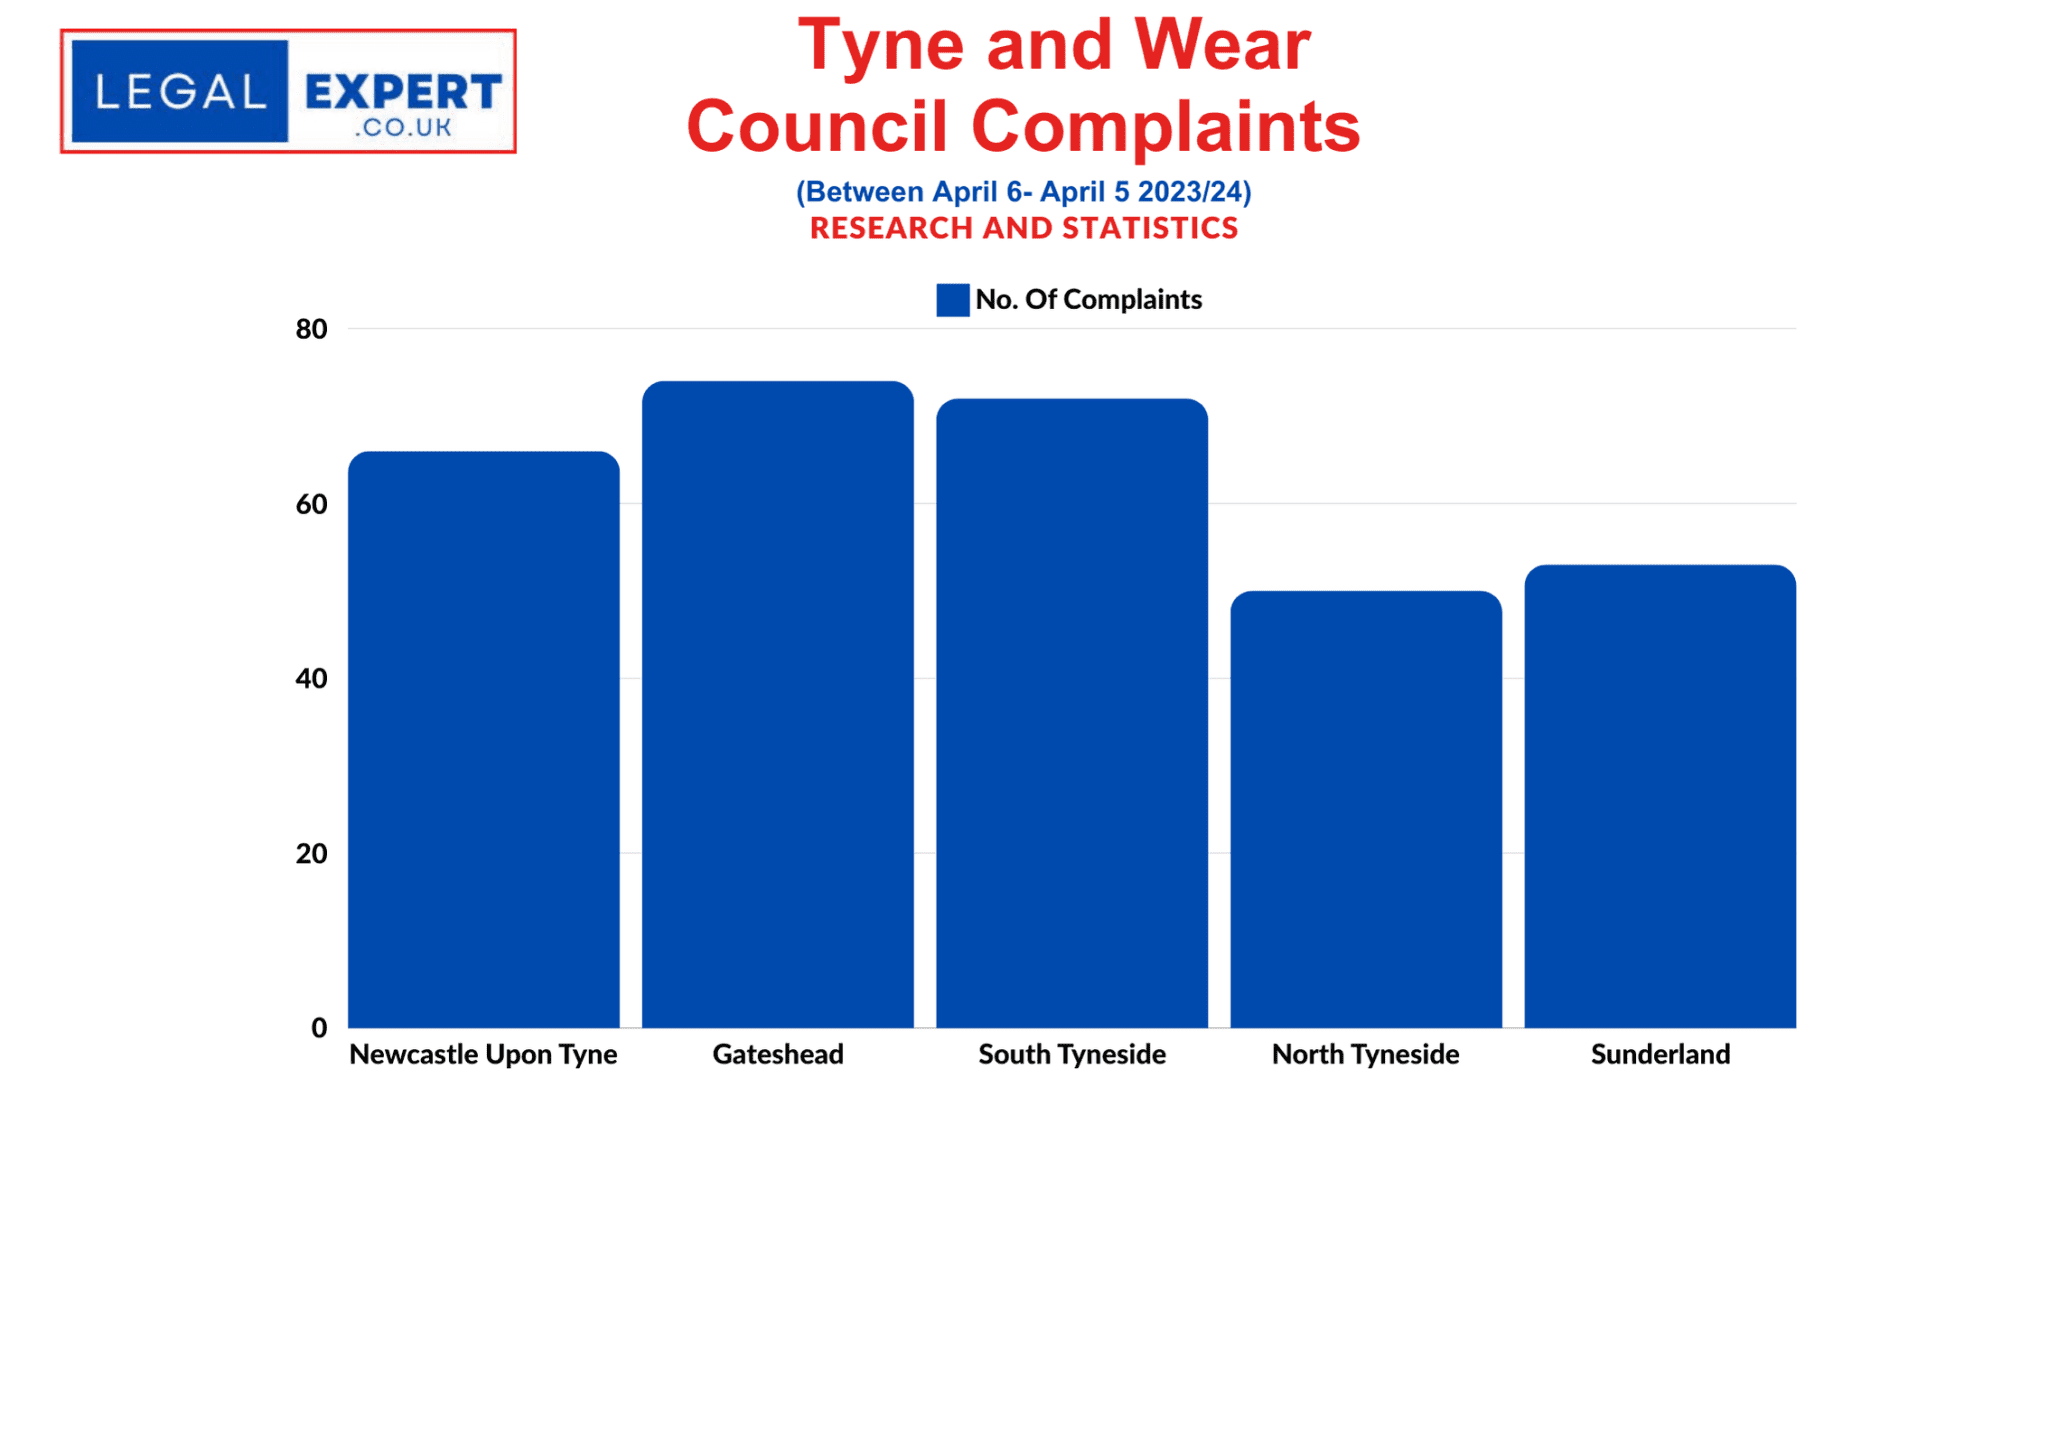
Council Complaints – Tyne and Wear Councils
Complaints by Sector
Adult and Social Care | 12
Benefits and Tax | 2
Corporate and Other Services | 4
Education and Children’s Services | 16
Environmental Services, Public Protection and Regulation | 10
Highways and Transport | 4
Housing | 23
Planning and Development | 2
Other | 1
Total No. of complaints: 74
Stockport Metropolitan Borough Council
Complaints by Sector
Adult and Social Care | 16
Benefits and Tax | 1
Corporate and Other Services | 4
Education and Children’s Services | 22
Environmental Services, Public Protection and Regulation | 8
Highways and Transport | 6
Housing | 1
Planning and Development | 13
Other | 2
Total No. of complaints: 73
South Tyneside Metropolitan Borough Council
Complaints by Sector
Adult and Social Care | 11
Benefits and Tax | 1
Corporate and Other Services | 11
Education and Children’s Services | 13
Environmental Services, Public Protection and Regulation | 18
Highways and Transport | 6
Housing | 6
Planning and Development | 5
Other | 1
Total No. of complaints: 72
Trafford Metropolitan Borough Council
Complaints by Sector
Adult and Social Care | 15
Benefits and Tax | 4
Corporate and Other Services | 0
Education and Children’s Services | 14
Environmental Services, Public Protection and Regulation | 15
Highways and Transport | 12
Housing | 7
Planning and Development | 3
Other | 1
Total No. of complaints: 71
Newcastle Upon Tyne City Council
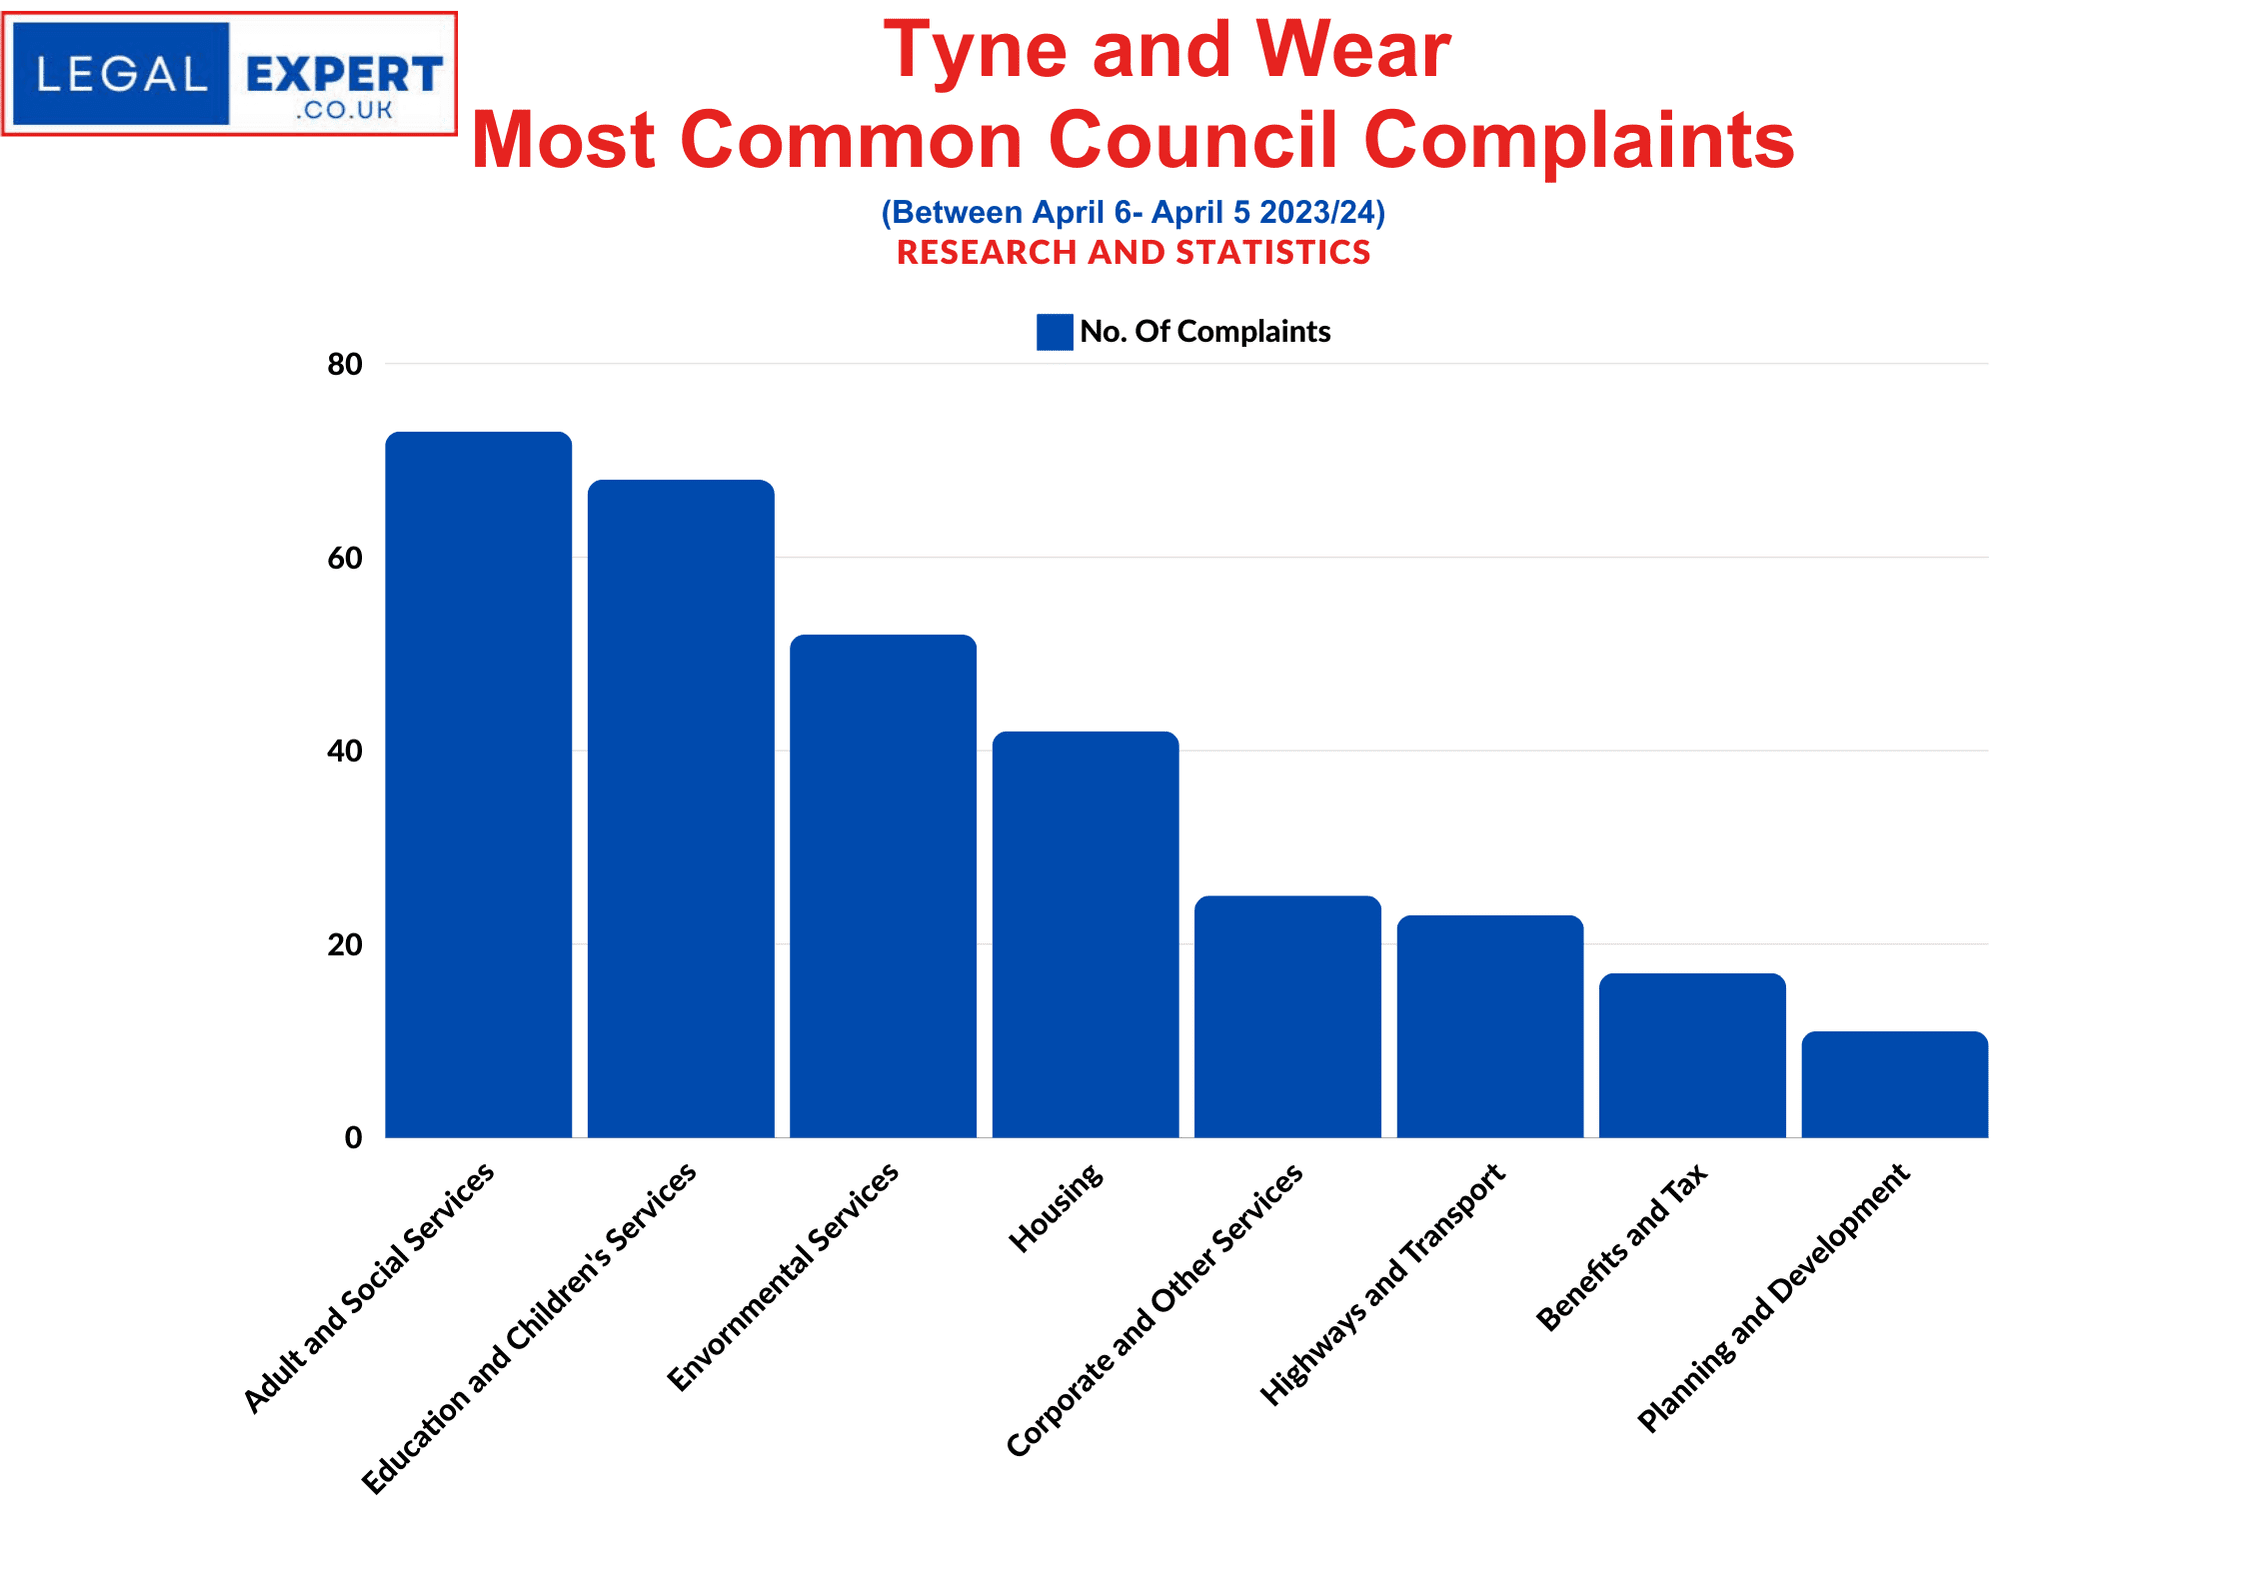
Council Complaints – Tyne and Wear Councils Services
Complaints by Sector
Adult and Social Care | 17
Benefits and Tax | 6
Corporate and Other Services | 1
Education and Children’s Services | 18
Environmental Services, Public Protection and Regulation | 9
Highways and Transport | 7
Housing | 8
Planning and Development | 0
Other | 0
Total No. of complaints: 66
Oldham Metropolitan Borough Council
Complaints by Sector
Adult and Social Care | 13
Benefits and Tax | 8
Corporate and Other Services | 8
Education and Children’s Services | 16
Environmental Services, Public Protection and Regulation | 3
Highways and Transport | 5
Housing | 8
Planning and Development | 4
Other | 1
Total No. of complaints: 66
Doncaster City Council
Complaints by Sector
Adult and Social Care | 9
Benefits and Tax | 5
Corporate and Other Services | 8
Education and Children’s Services | 15
Environmental Services, Public Protection and Regulation | 6
Highways and Transport |1
Housing | 7
Planning and Development | 10
Other | 2
Total No. of complaints: 63
Rochdale Metropolitan Borough Council
Complaints by Sector
Adult and Social Care | 13
Benefits and Tax | 6
Corporate and Other Services | 6
Education and Children’s Services | 19
Environmental Services, Public Protection and Regulation | 4
Highways and Transport | 5
Housing | 7
Planning and Development | 1
Other | 1
Total No. of complaints: 62
Wigan Metropolitan Borough Council
Complaints by Sector
Adult and Social Care | 15
Benefits and Tax | 4
Corporate and Other Services | 0
Education and Children’s Services | 23
Environmental Services, Public Protection and Regulation | 5
Highways and Transport | 1
Housing | 4
Planning and Development | 9
Other | 1
Total No. of complaints: 62
Wakefield City Council
Complaints by Sector
Adult and Social Care | 11
Benefits and Tax | 3
Corporate and Other Services | 1
Education and Children’s Services | 19
Environmental Services, Public Protection and Regulation | 4
Highways and Transport | 7
Housing | 5
Planning and Development | 11
Other | 0
Total No. of complaints: 61
Bolton Metropolitan Borough Council
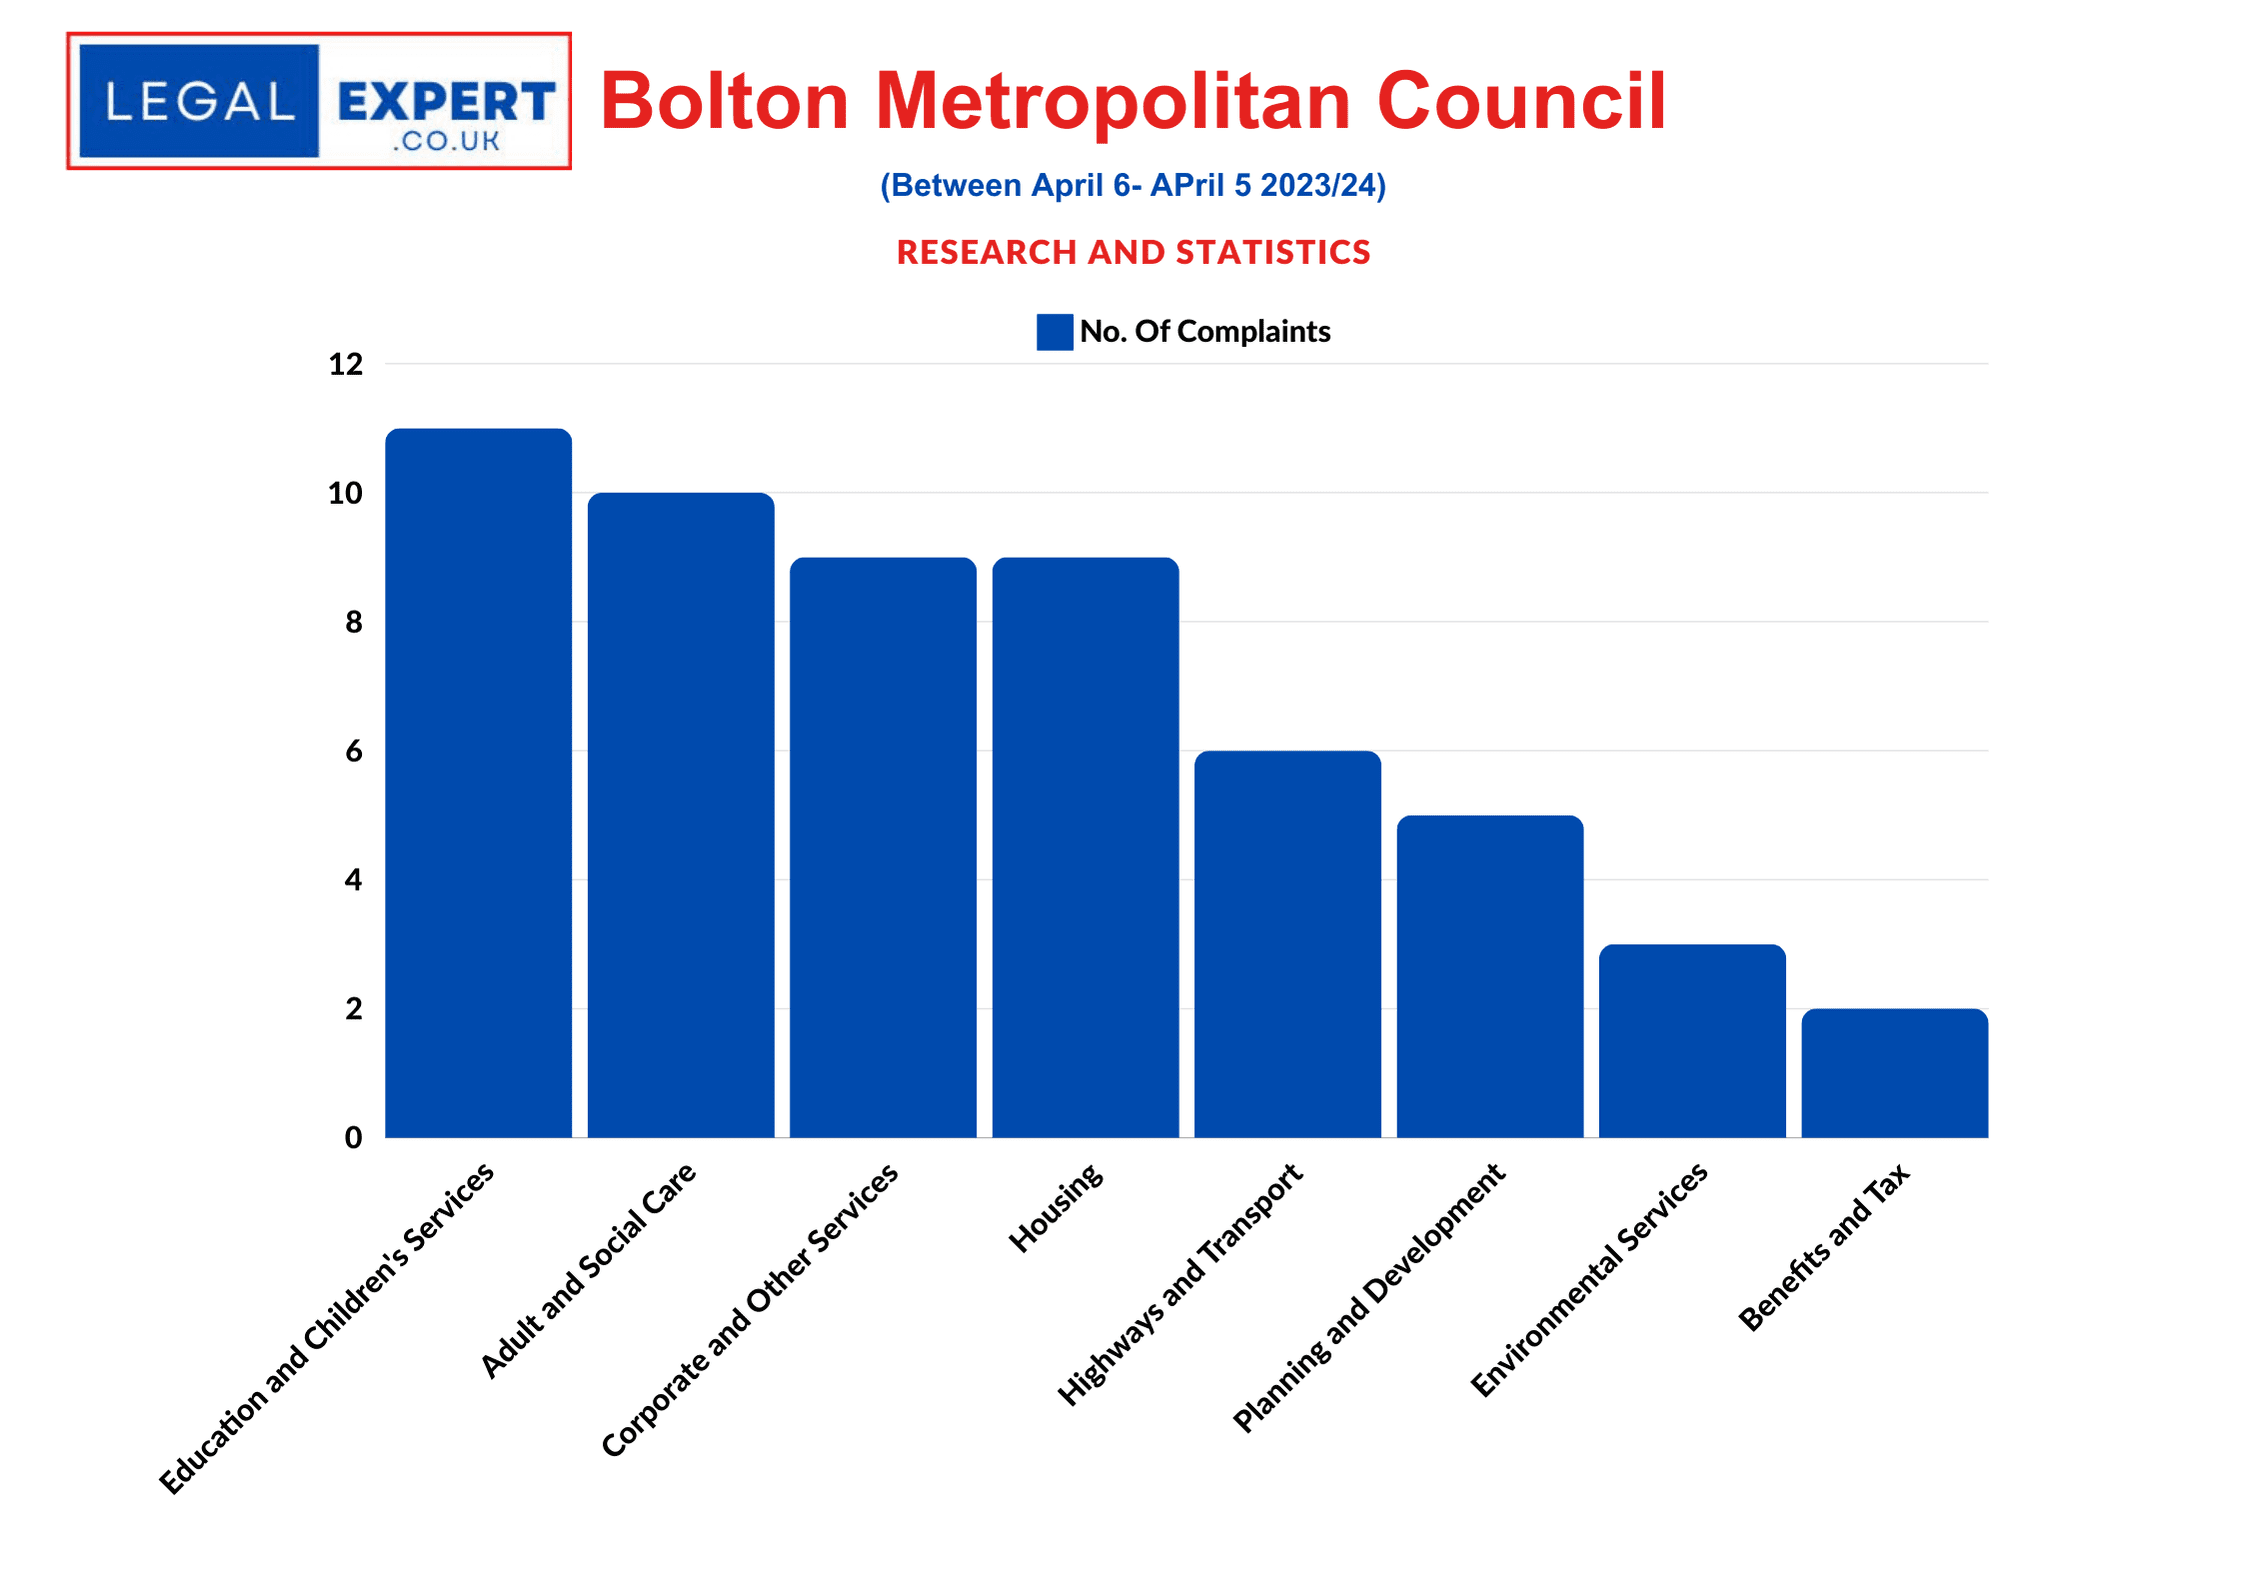
Council Complaints – Bolton MB Council
Complaints by Sector
Adult and Social Care | 10
Benefits and Tax | 2
Corporate and Other Services | 9
Education and Children’s Services | 11
Environmental Services, Public Protection and Regulation | 3
Highways and Transport | 6
Housing | 9
Planning and Development | 5
Other | 1
Total No. of complaints: 56
St. Helens Metropolitan Borough Council
Complaints by Sector
Adult and Social Care | 14
Benefits and Tax | 1
Services | 8
Education and Children’s Services | 17
Environmental Services, Public Protection and Regulation | 6
Highways and Transport | 4
Housing | 2
Planning and Development | 3
Other | 0
Total No. of complaints: 55
Tameside Metropolitan Borough Council
Complaints by Sector
Adult and Social Care | 7
Benefits and Tax | 4
Corporate and Other Services | 0
Education and Children’s Services | 26
Environmental Services, Public Protection and Regulation | 4
Highways and Transport | 2
Housing | 3
Planning and Development | 9
Other | 0
Total No. of complaints: 55
Sunderland City Council
Complaints by Sector
Adult and Social Care | 17
Benefits and Tax | 4
Corporate and Other Services | 4
Education and Children’s Services | 11
Environmental Services, Public Protection and Regulation | 10
Highways and Transport | 3
Housing | 0
Planning and Development | 2
Other | 2
Total No. of complaints: 53
Walsall Metropolitan Borough Council
Complaints by Sector
Adult and Social Care | 8
Benefits and Tax | 4
Corporate and Other Services | 2
Education and Children’s Services | 20
Environmental Services, Public Protection and Regulation | 6
Highways and Transport | 2
Housing | 3
Planning and Development | 8
Other | 0
Total No. of complaints: 53
Solihill Metropolitan Borough Council
Complaints by Sector
Adult and Social Care | 6
Benefits and Tax | 3
Corporate and Other Services | 1
Education and Children’s Services | 24
Environmental Services, Public Protection and Regulation | 2
Highways and Transport | 3
Housing | 7
Planning and Development | 4
Other | 2
Total No. of complaints: 52
Rotherham Metropolitan Borough Council
Complaints by Sector
Adult and Social Care | 9
Benefits and Tax | 7
Corporate and Other Services | 7
Education and Children’s Services | 12
Environmental Services, Public Protection and Regulation | 1
Highways and Transport | 1
Housing | 6
Planning and Development | 8
Other | 0
Total No. of complaints: 51
North Tyneside Metropolitan Borough Council
Complaints by Sector
Adult and Social Care | 16
Benefits and Tax | 4
Corporate and Other Services | 5
Education and Children’s Services | 10
Environmental Services, Public Protection and Regulation | 5
Highways and Transport | 3
Housing | 5
Planning and Development | 2
Other | 0
Total No. of complaints: 50
Sefton Metropolitan Borough Council
Complaints by Sector
Adult and Social Care | 11
Benefits and Tax | 2
Corporate and Other Services | 3
Education and Children’s Services | 17
Environmental Services, Public Protection and Regulation | 5
Highways and Transport | 3
Housing | 4
Planning and Development | 4
Other | 0
Total No. of complaints: 49
Wolverhampton City Council
Complaints by Sector
Adult and Social Care | 9
Benefits and Tax | 3
Corporate and Other Services | 2
Education and Children’s Services | 12
Environmental Services, Public Protection and Regulation | 7
Highways and Transport | 3
Housing | 9
Planning and Development |3
Other | 0
Total No. of complaints: 48
Barnsley Metropolitan Borough Council
Complaints by Sector
Adult and Social Care | 3
Benefits and Tax | 2
Corporate and Other Services | 3
Education and Children’s Services | 18
Environmental Services, Public Protection and Regulation | 7
Highways and Transport | 4
Housing | 8
Planning and Development | 1
Other | 1
Total No. of complaints: 47
Knowsley Metropolitan Borough Council
Complaints by Sector
Adult and Social Care | 8
Benefits and Tax | 4
Corporate and Other Services | 1
Education and Children’s Services | 11
Environmental Services, Public Protection and Regulation | 3
Highways and Transport | 2
Housing | 5
Planning and Development | 1
Other | 0
Total No. of complaints: 35