- How Legal Expert Can Help
- Get Help With Claiming Compensation For Drunk Driving Accidents
- How We Conducted Our Research Into Drink Driving Offences
- The Results Of Our Research Into Drink-Driving

 Skip to content
 The latest data released by the Department for Transport in 2024 revealed that UK drink-driving deaths have hit a 13-year-high.
There were an estimated 300 deaths where at least one driver was over the legal blood-alcohol limit in 2022, the latest year for which official figures are available. This is the highest annual figure since 2009.
The number is 16 per cent higher than in 2021 and means drink-drive fatalities accounted for about 18 per cent of all deaths, bucking the general long-term trend for safer roads and more responsible driving.
Legal Expert’s Road Traffic Accident Specialist, Tracy Chick says: “It is deeply concerning that drink-drive-related deaths have reached their highest level since 2009. Anyone who drinks and drives is putting the lives of all road users at risk.
“The impact of drink-driving can be devastating not only for victims who have been killed or suffered life-changing injuries but also for the drivers facing serious legal consequences – it is such an avoidable offence and there is no excuse for drinking and getting behind the wheel.
“Throughout my legal career, I have worked with victims and families of drink-driving collisions and the impact is immense. Thankfully, I’ve been able to bring even a small comfort by securing them the compensation they deserve to help to start to rebuild their lives.”
Here at Legal Expert, we specialise in road traffic accident claims and have significant experience in cases involving drunk drivers. If you’d like free advice on your case, get in touch with us today. We provide a consultation where you can get guidance on your situation and your rights.
If you’ve been involved in a car accident with a drunk driver, then you could claim compensation for any injuries and damage to your property.
We’ve compiled a comprehensive guide on drunk driving accident compensation claims, which you can view here.
You can also contact us for free legal advice by calling us on the number at the top of this page.
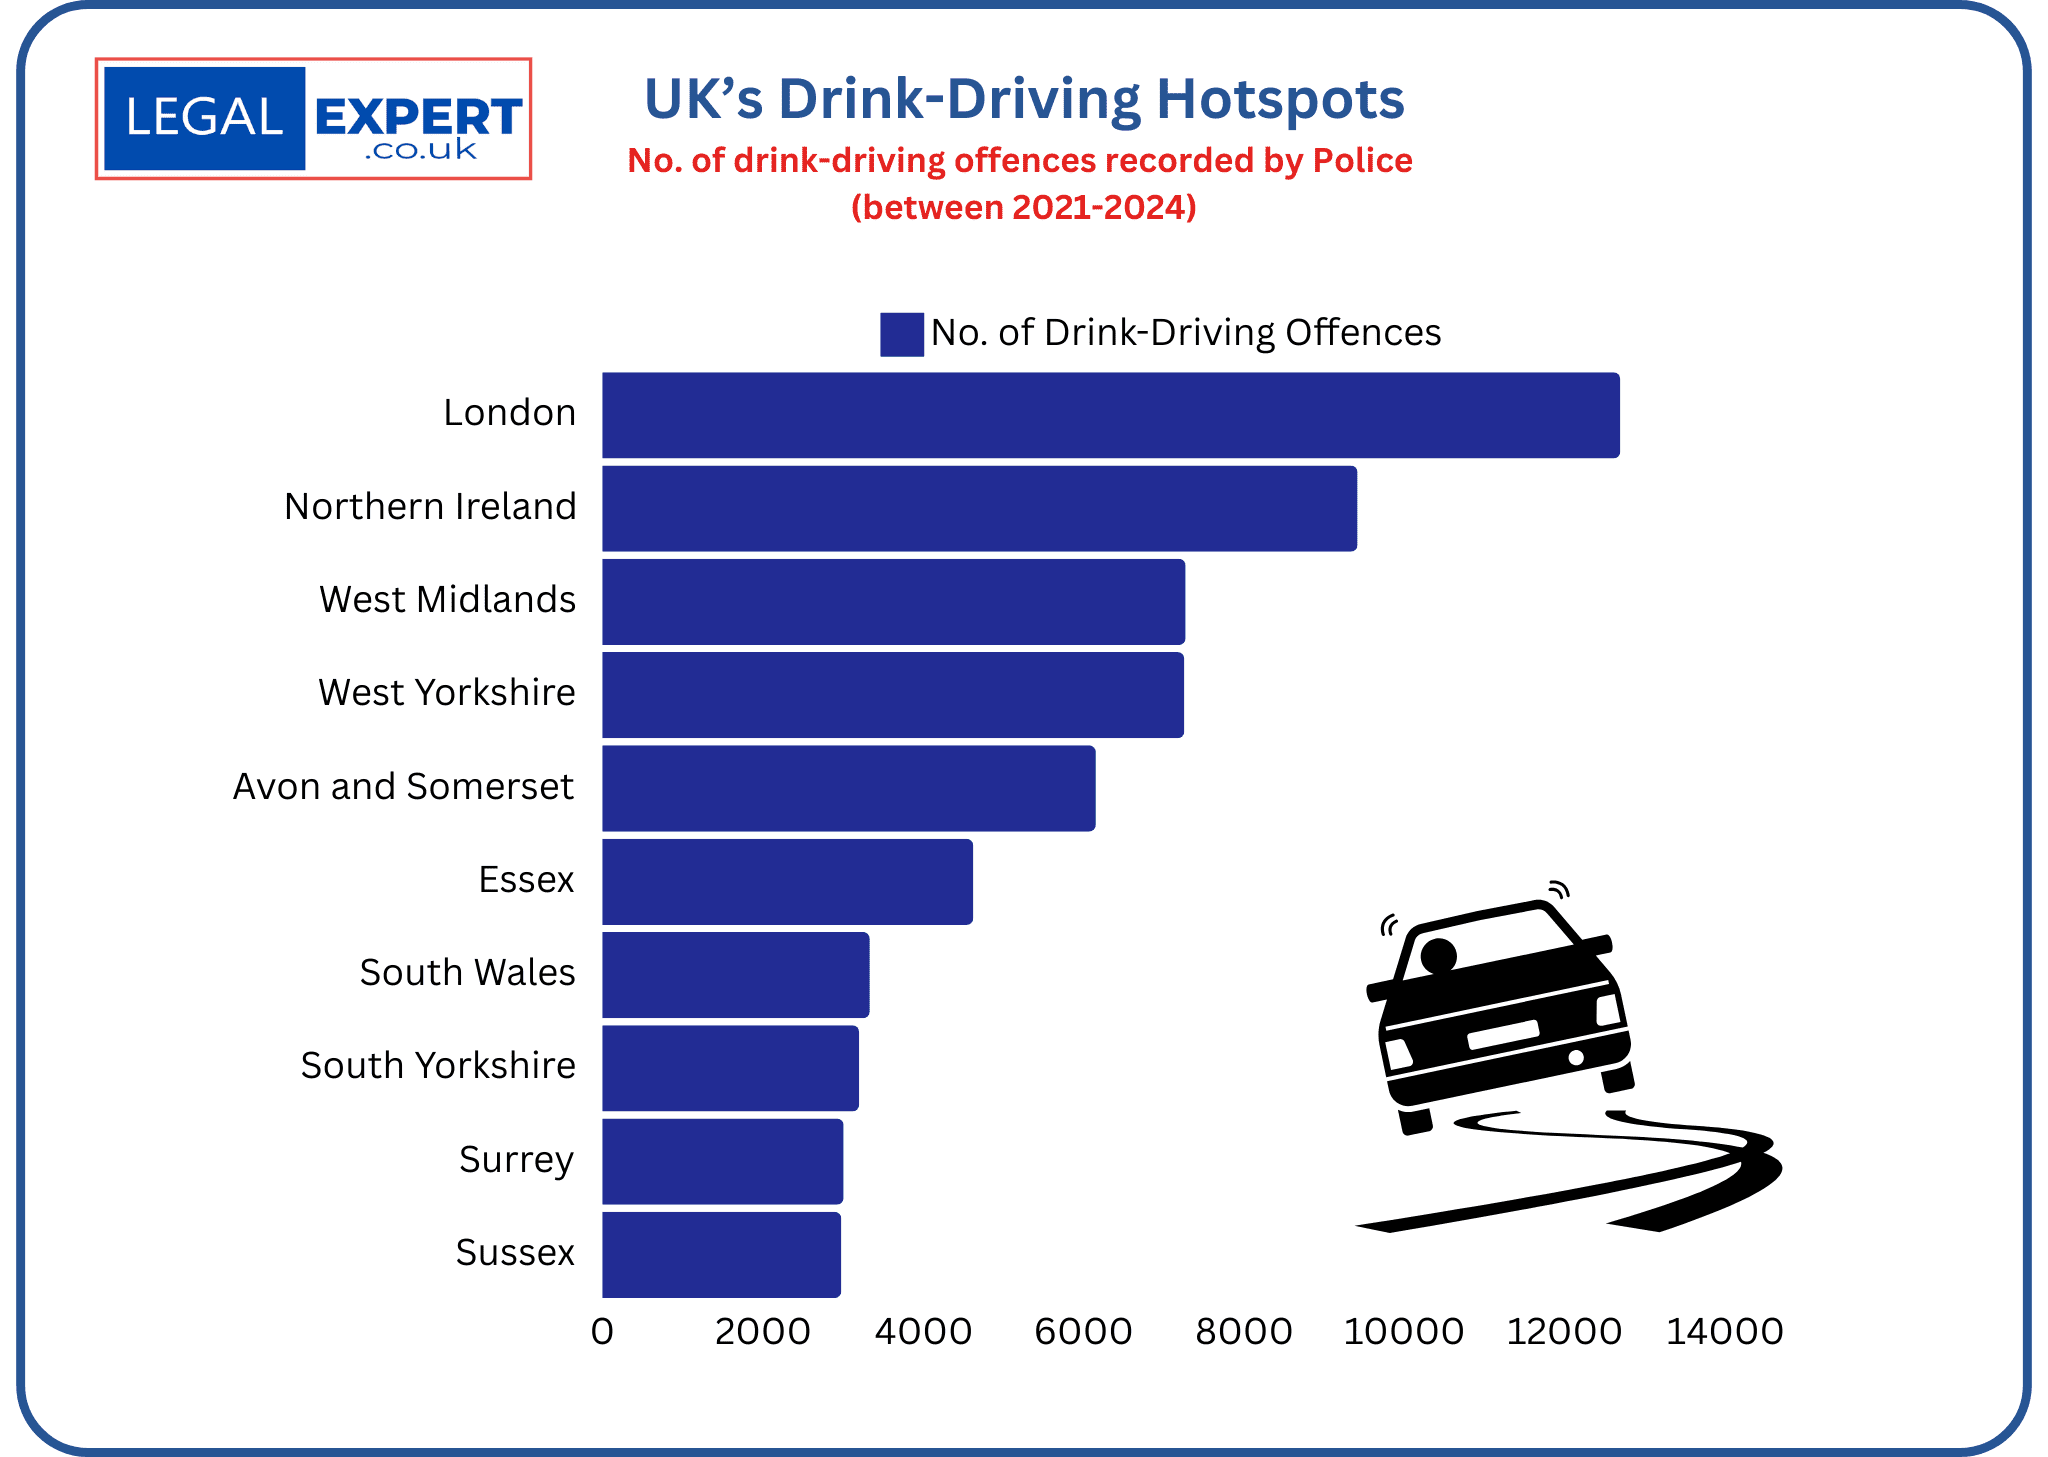
Following an influx of inquiries from victims of drink-driving collisions from across the UK, Legal Expert set out to investigate to the extent of the issue and to find the most prevelant areas for drink-driving offences in the UK.
We sent out Freedom of Information Requests to every UK Police Force asking for the number of drink-driving offences recorded in the last three years (between December 1st – November 31st, 2021/22, 2022/23 and 2023/24).
We also asked of those, how many drivers were charged.
For the last year alone, 2023/24, we also asked for the age and gender of the suspect and the areas in which the offence took place.
See below for the results in your area.
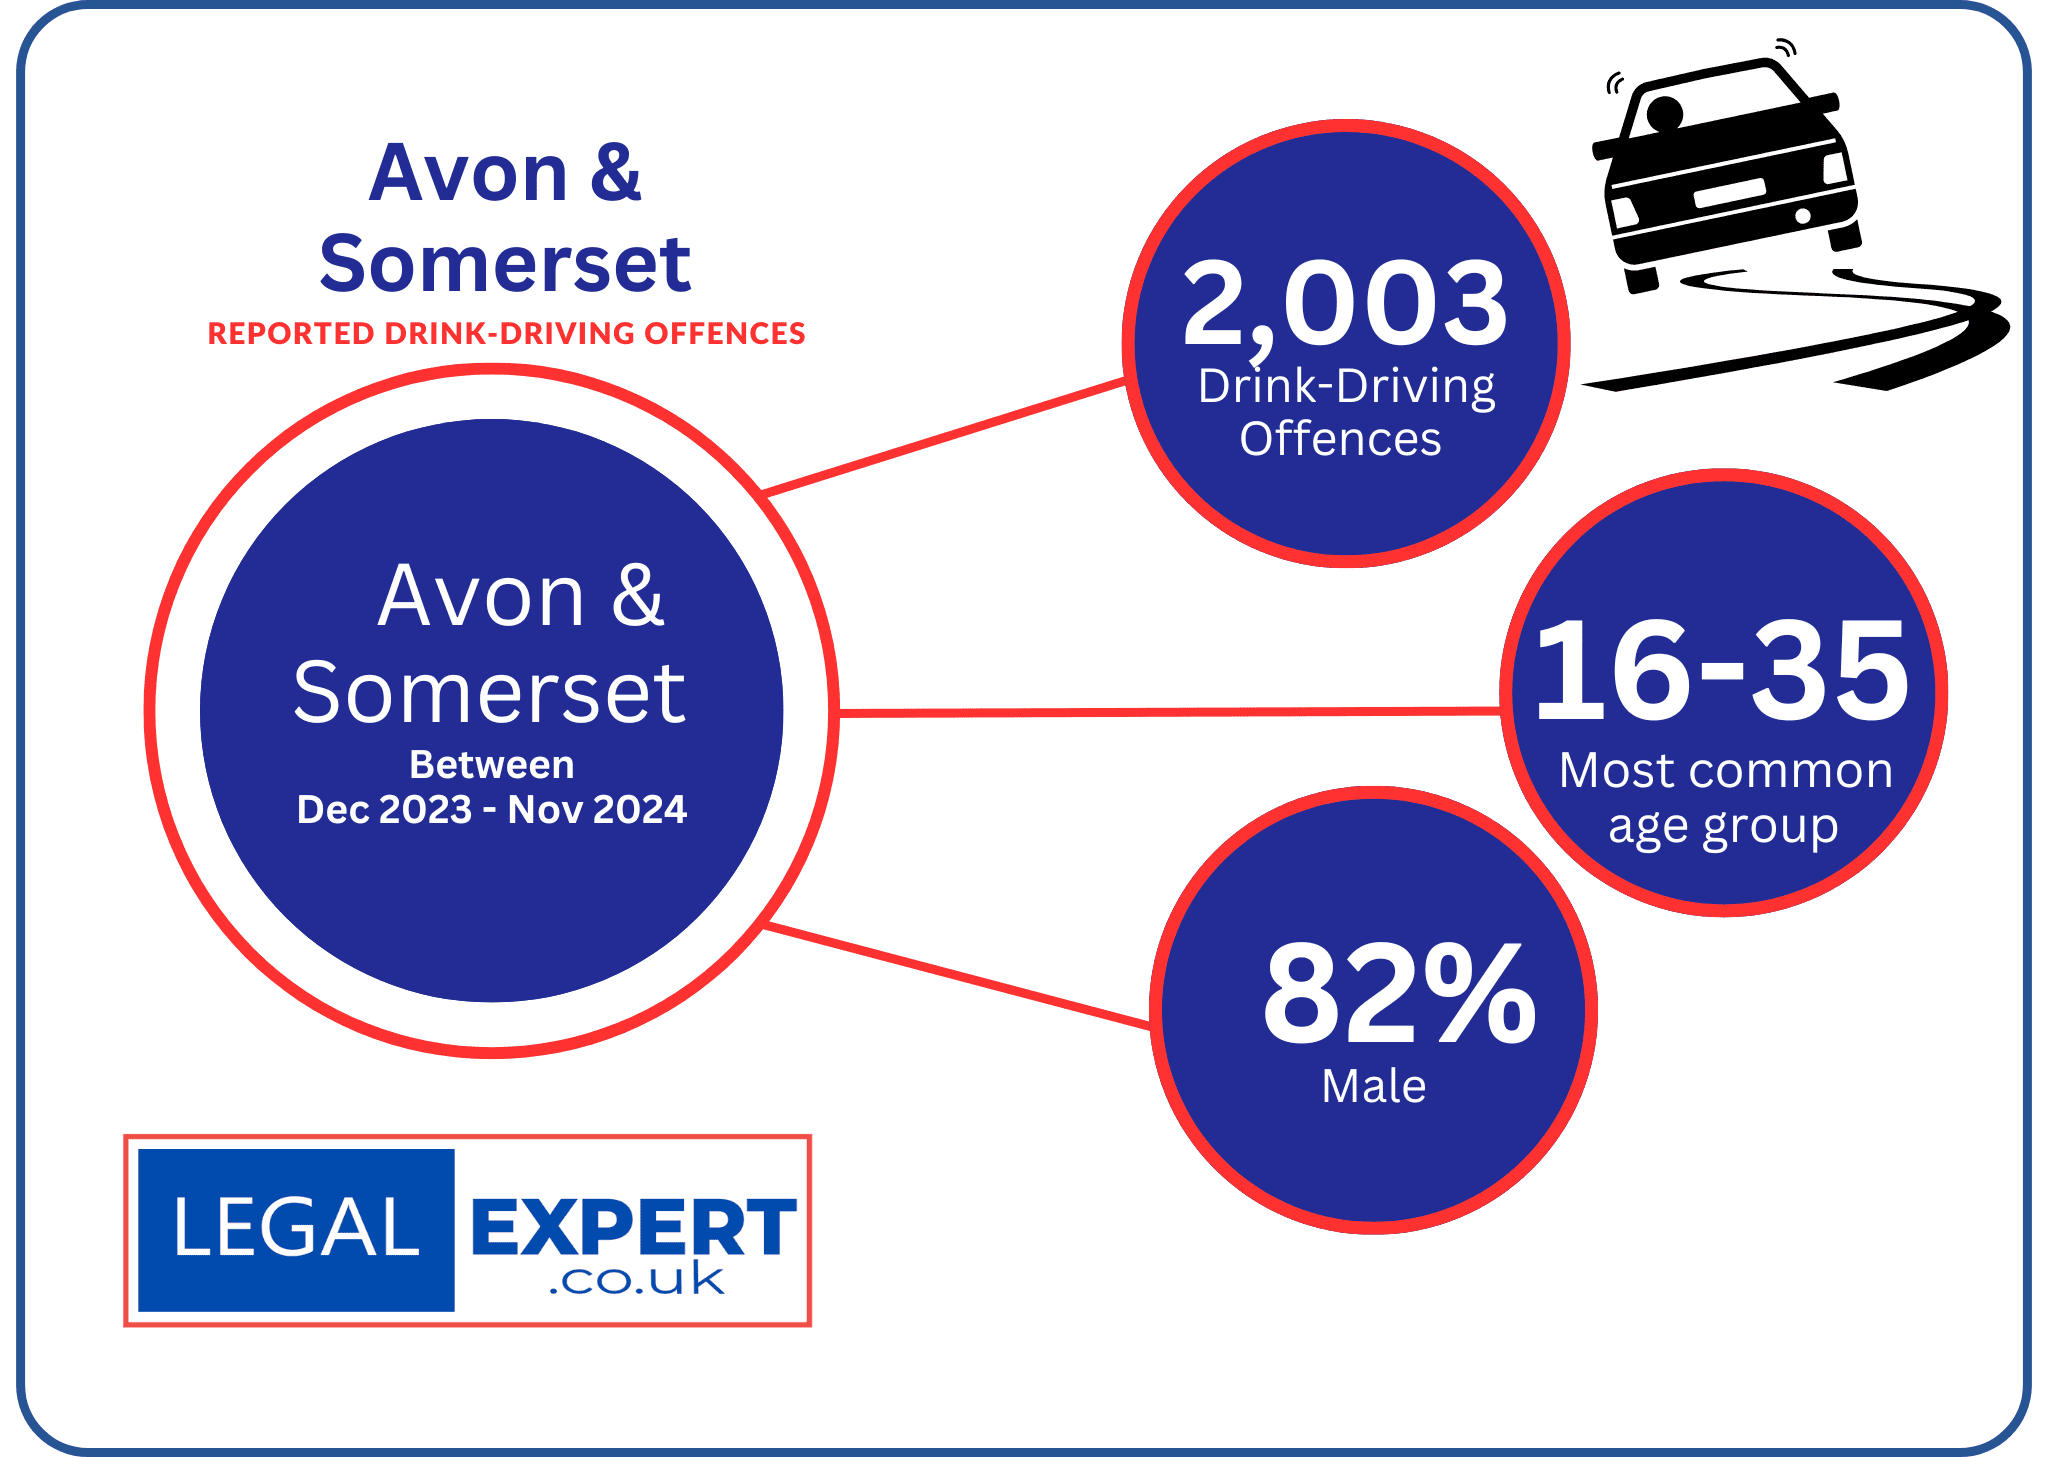
No. of drink-driving offences (between 2021-2024) | 6,151
No. of charges | 3,400 (55%)
Most Common Age Group | 16-35 (48%)
Gender | Male 82%

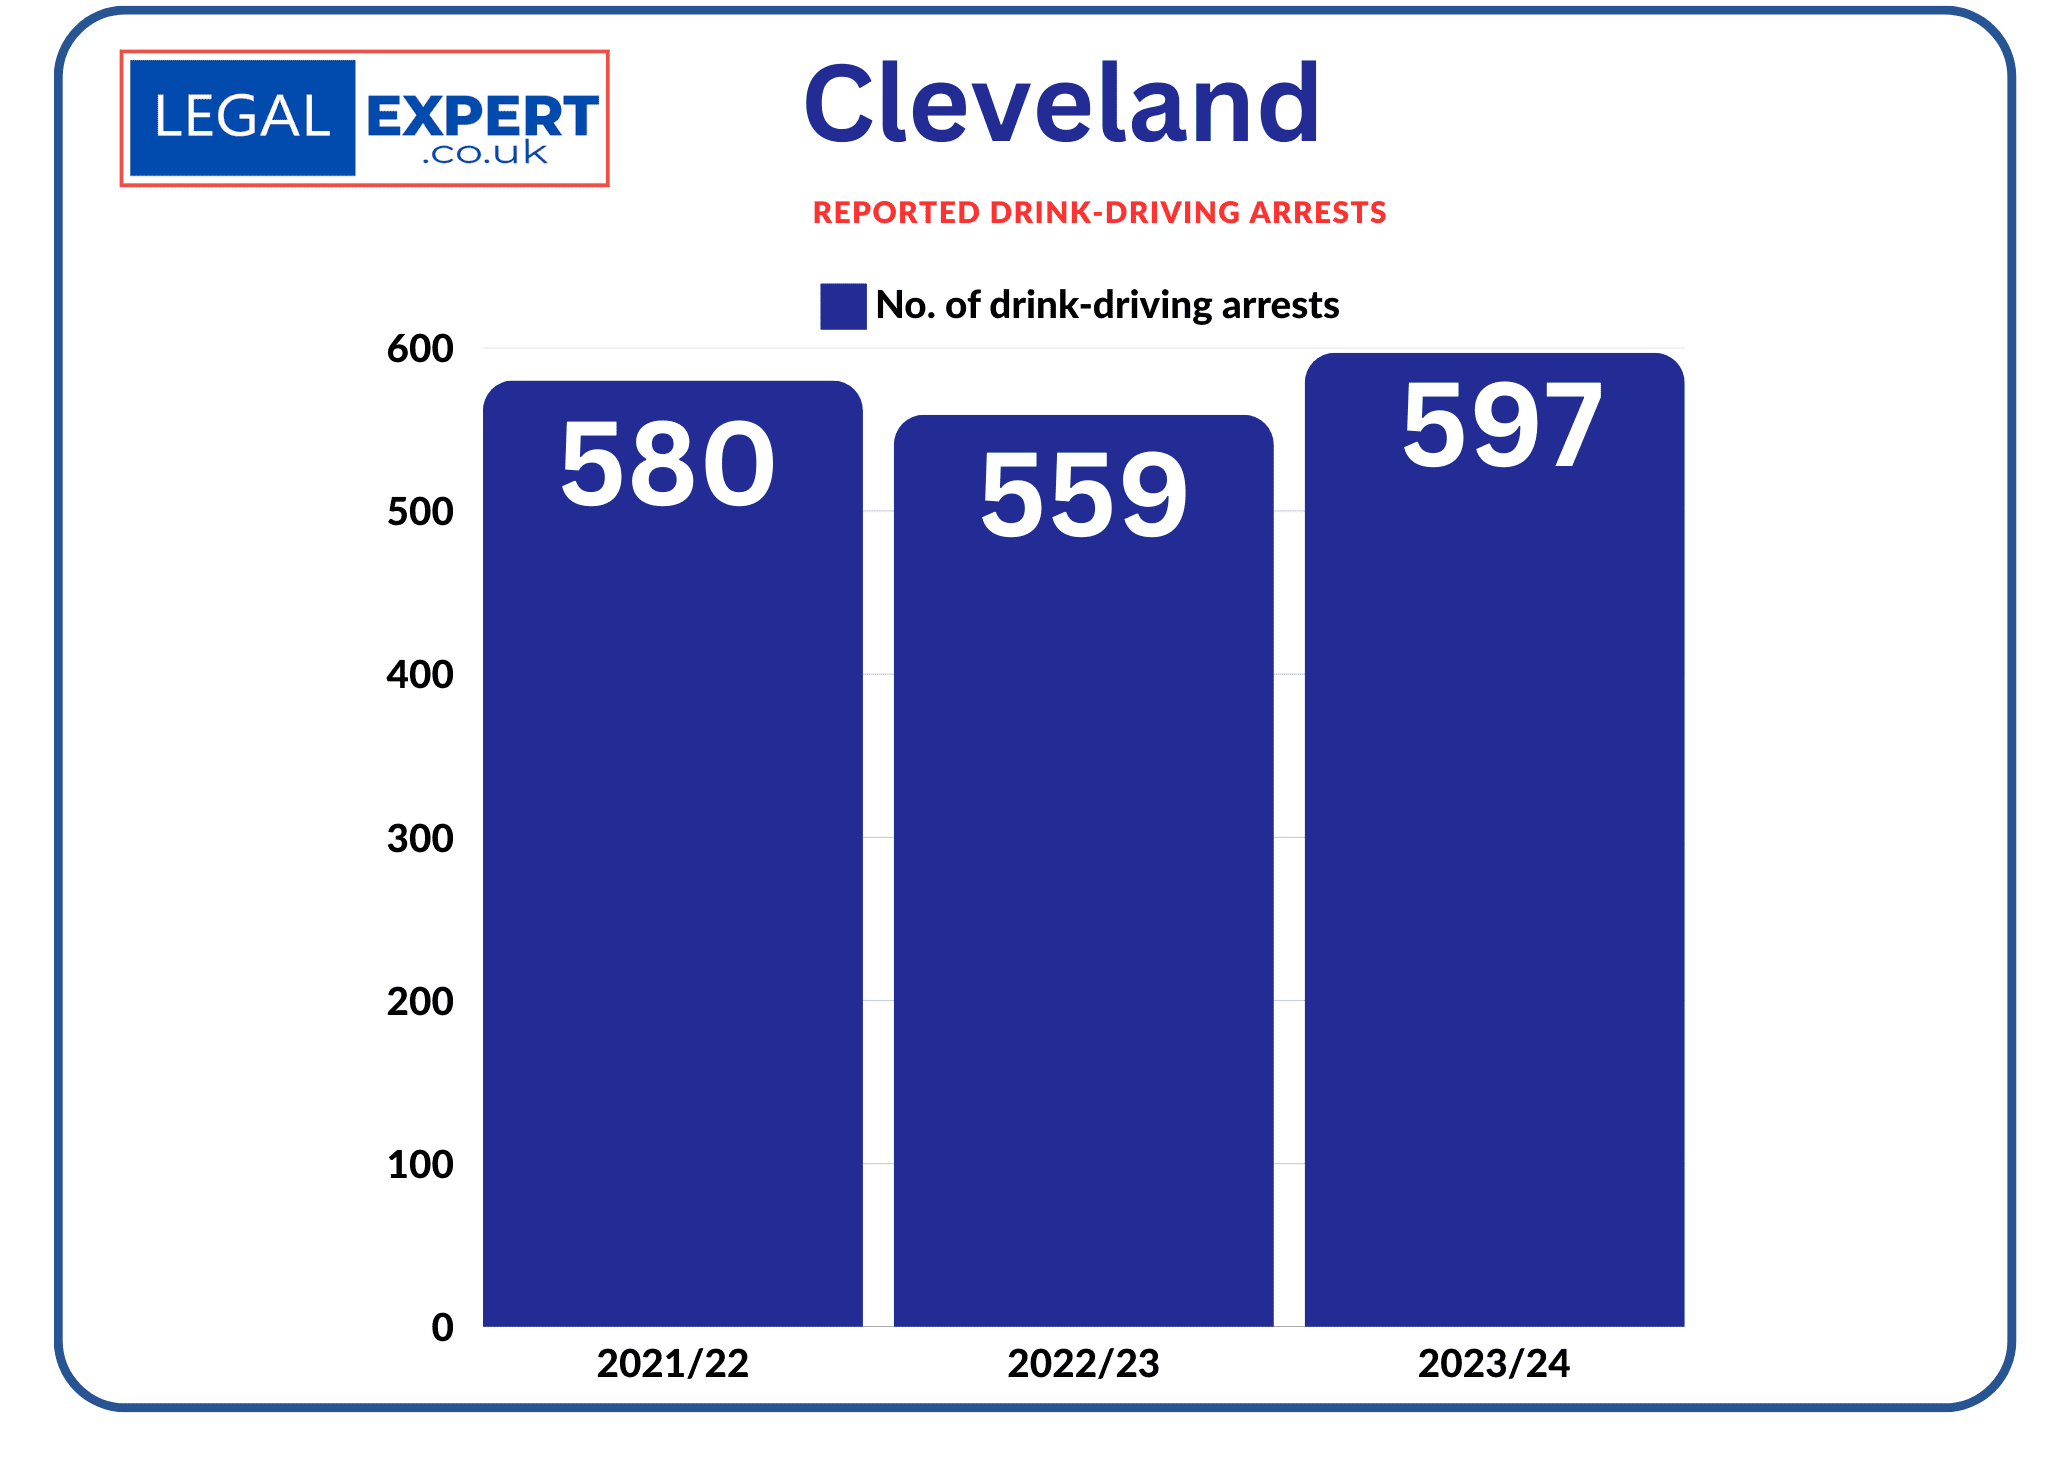
No. of drink-driving arrests (between 2021-2024) | 1,763
No. of charges | 1,102 (63%)
For 2023/24:
Most Common Age Group | 16-35 48%
Gender | Female (88) | Male (426) 83%

No. of drink-driving arrests (between 2021-2024) | 1,881
No. of charges | 1,203 (64%)
Most Common Age Group | 31-40 32%
Gender | Female (288) | Male (1584) 84%

No. of drink-driving arrests (between 2021-2024) | 3,160
No. of charges | 2,543 (80%)
Most Common Age Group | 26-35 (28%)
Gender | Female (199) | Male (751) 79%
No. of drink-driving arrests (between 2021-2024) | 1,736
No. of charges | 823 (47%)
For 2023/24:
Most Common Age Group | 31-40 (33%)
Gender | Female (128) | Male (463) 78%
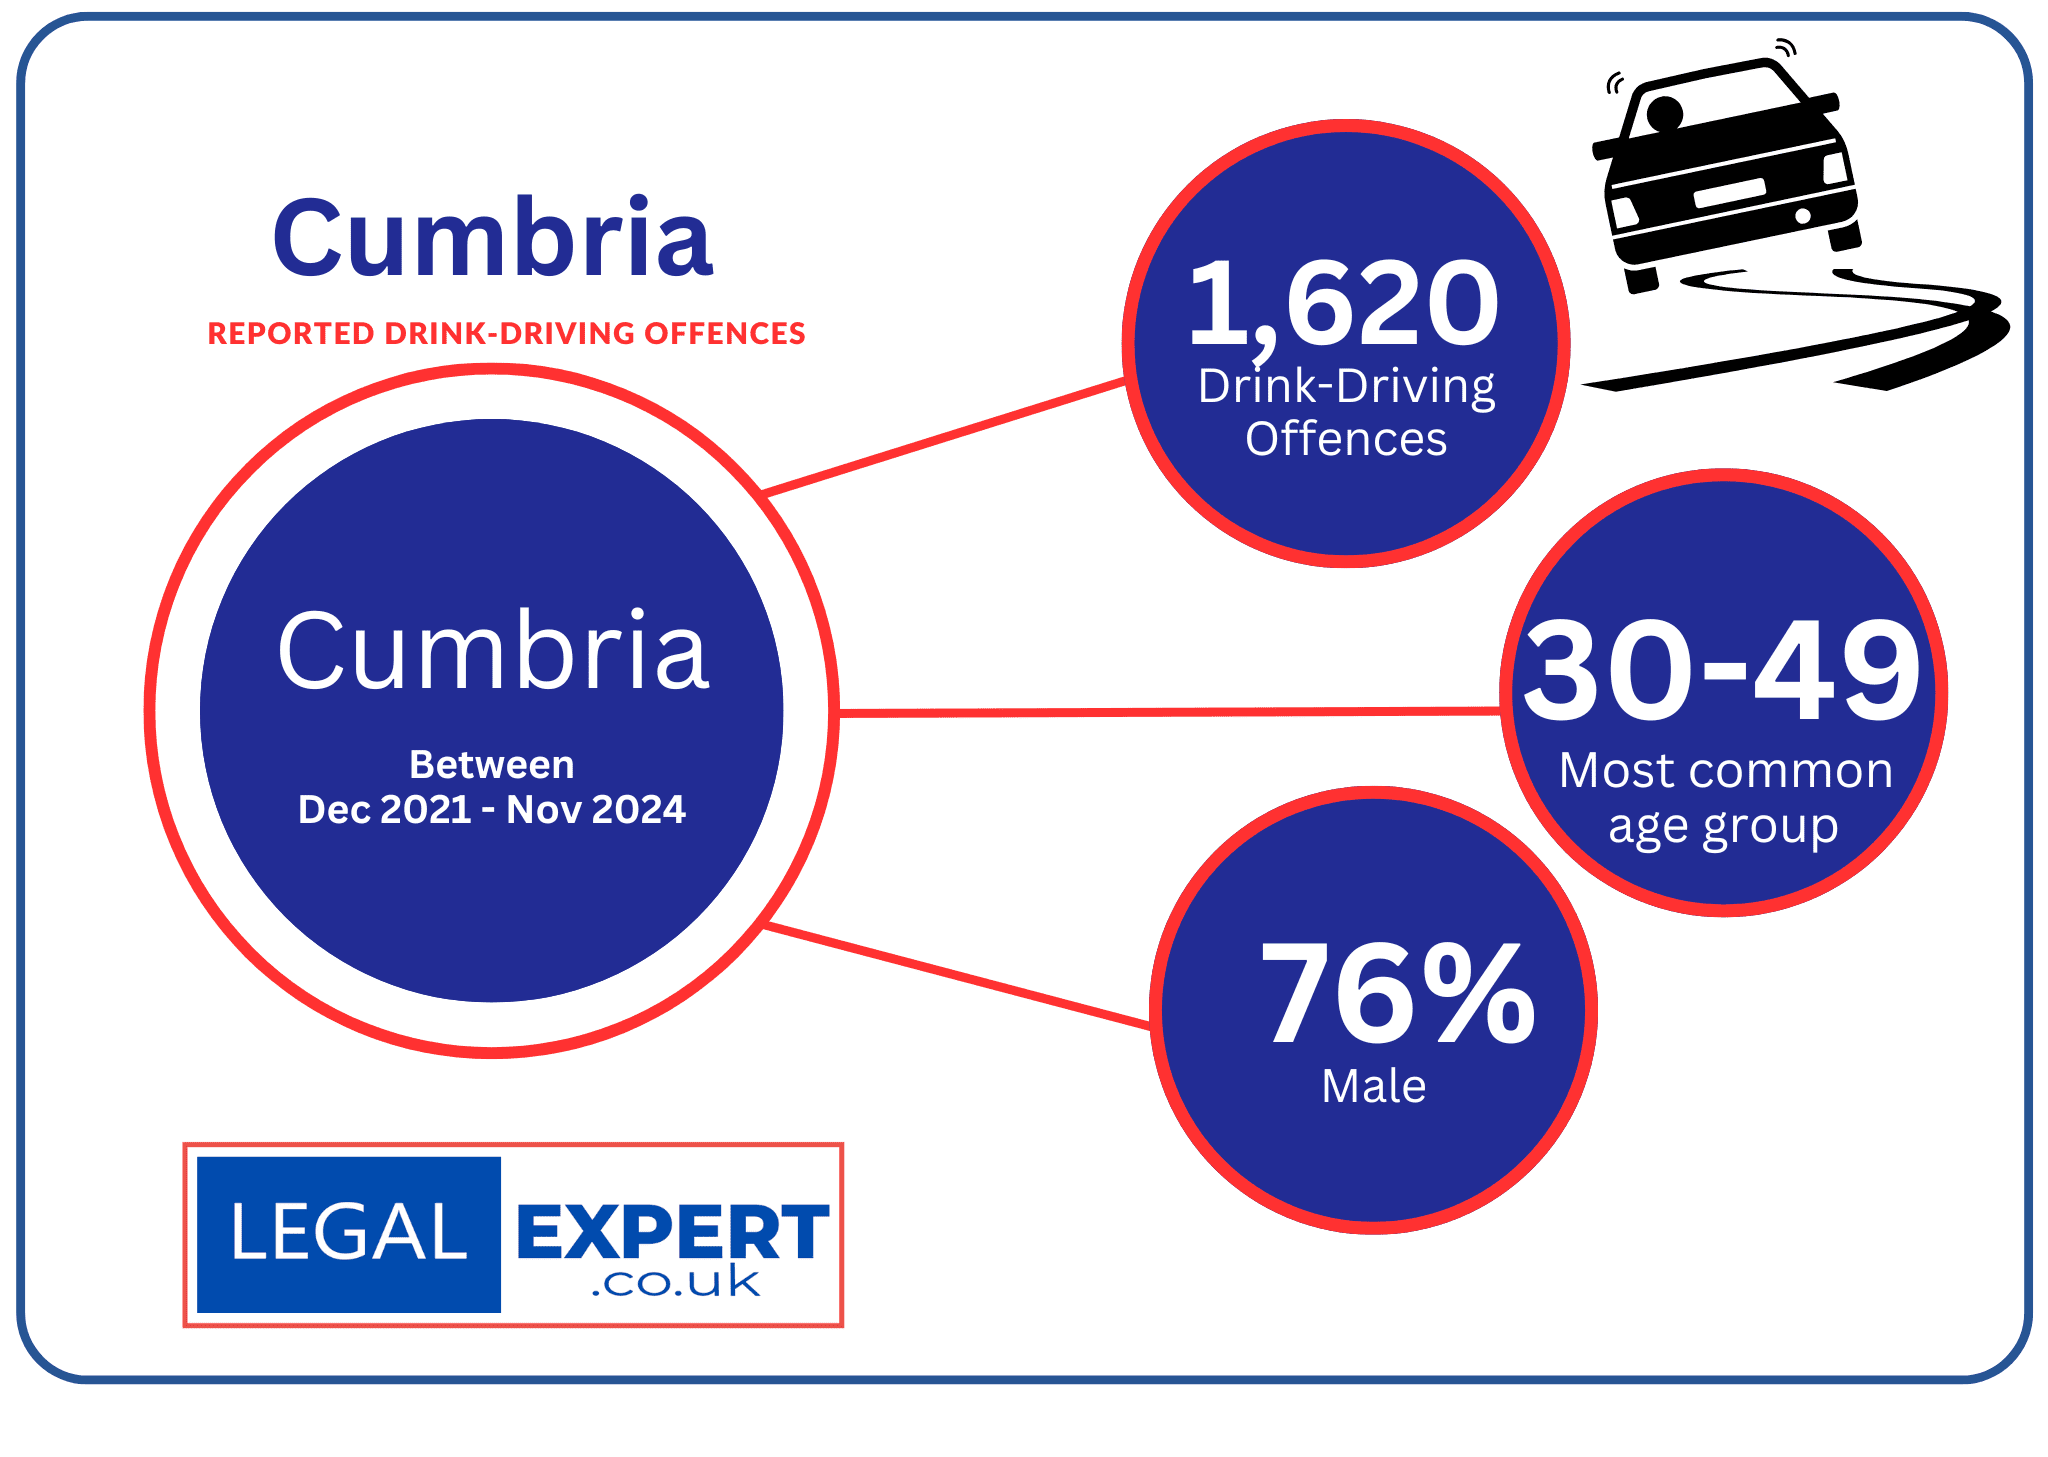
No. of drink-driving arrests (between 2021-2024) | 1,620
No. of charges | 1,214 (75%)
For 2023/24:
Most Common Age Group | 30-49 (50%)
Gender | Female (126) | Male (395) 76%
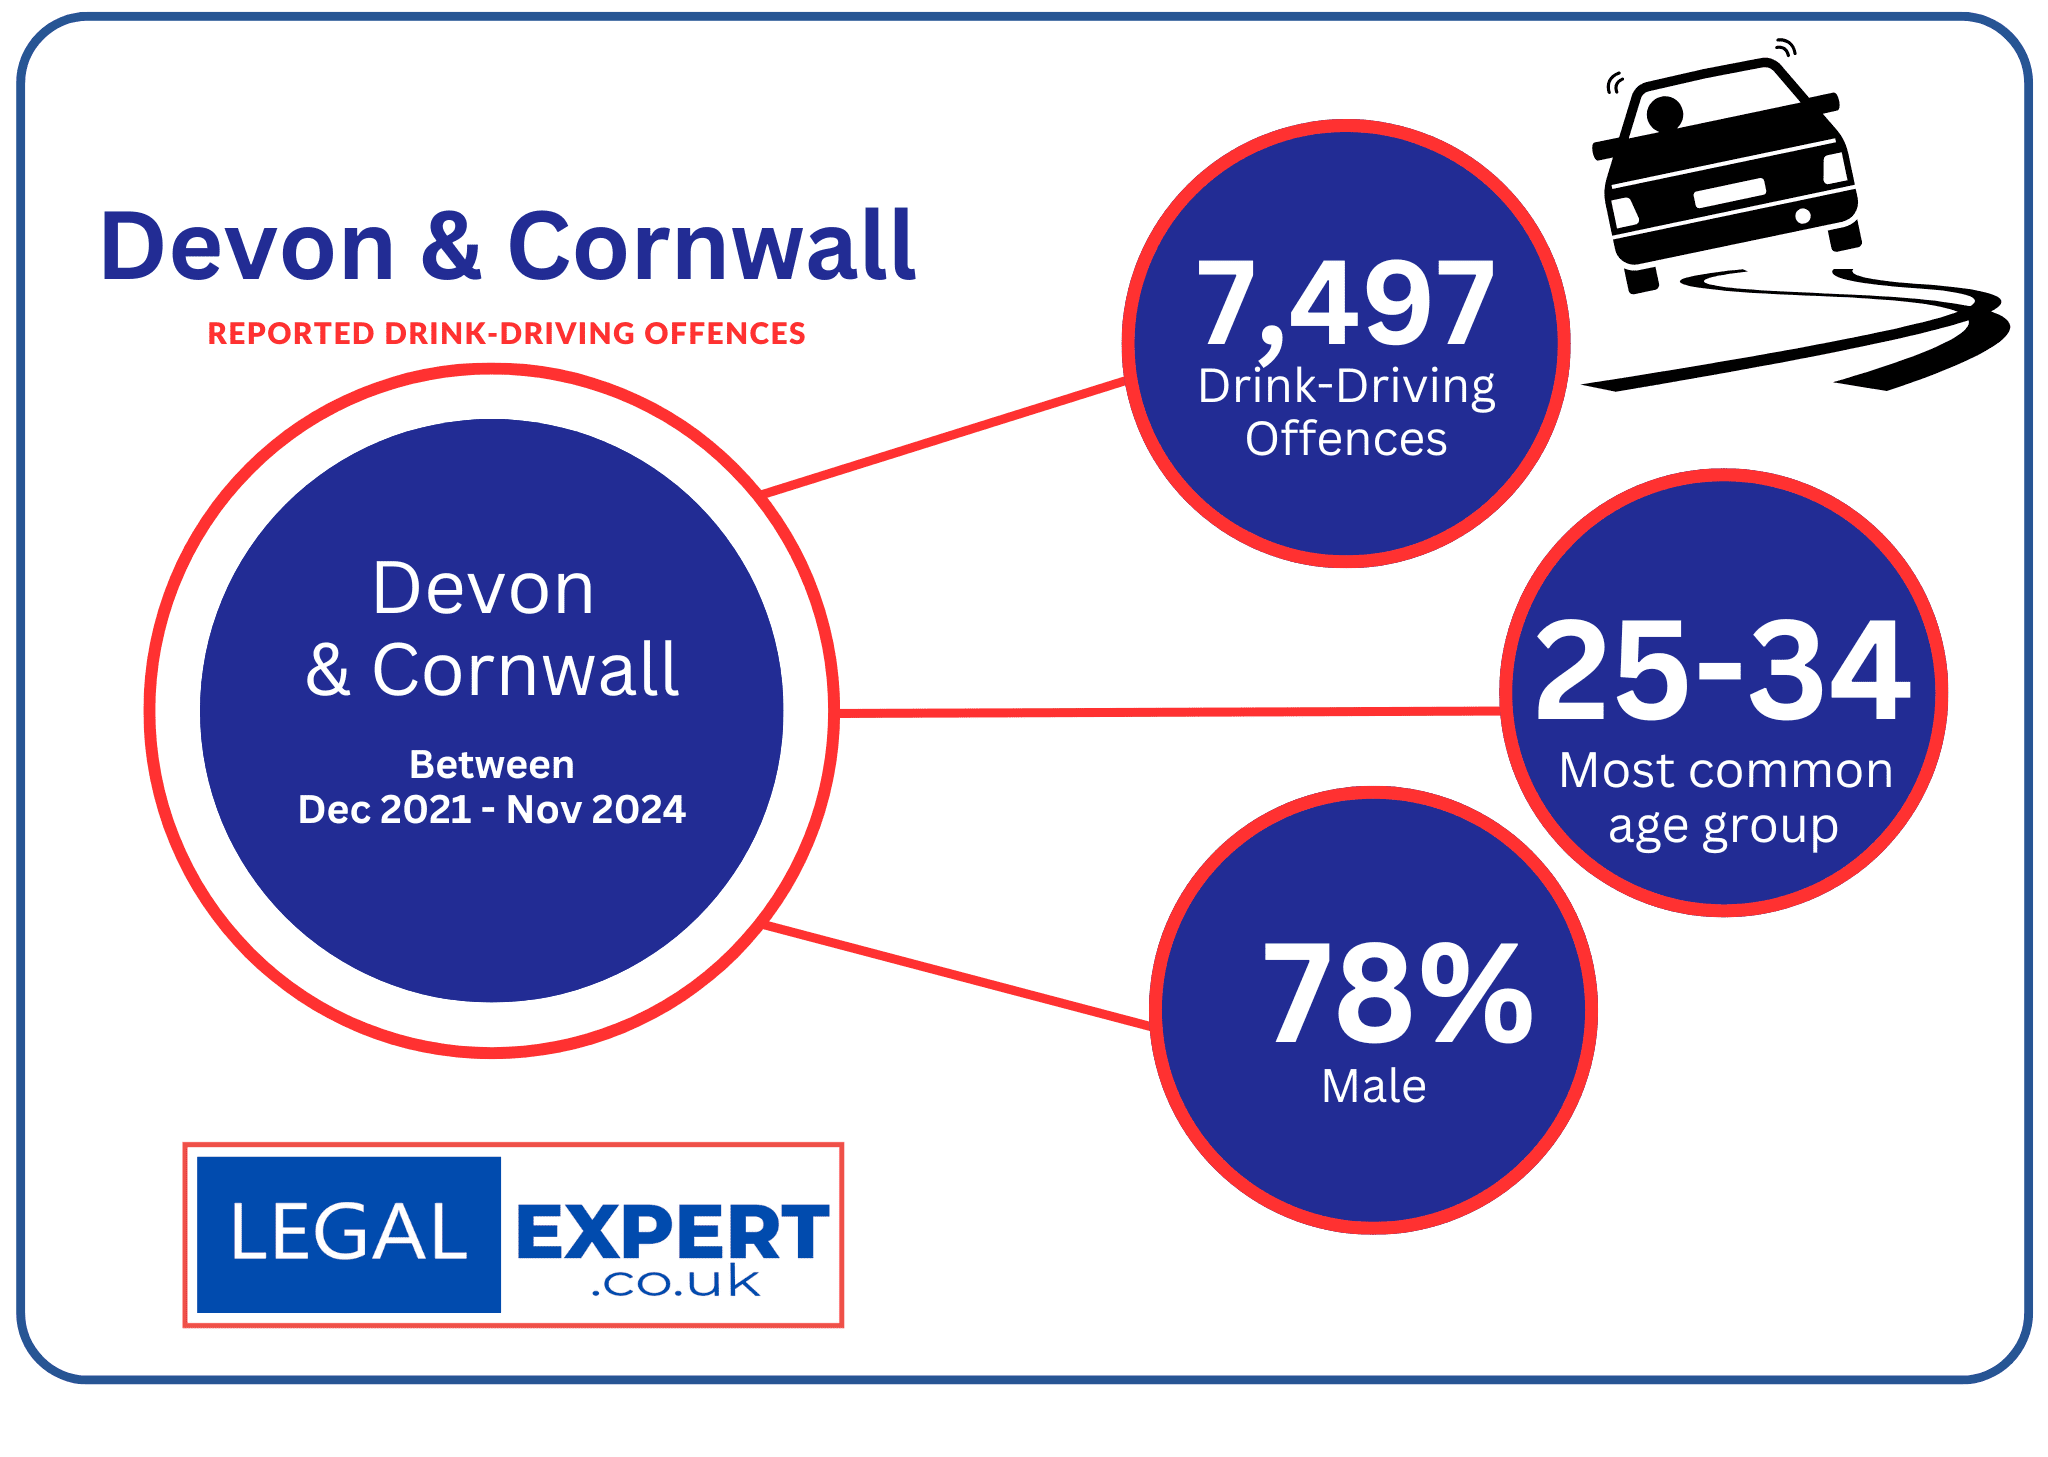
No. of drink-driving arrests (between 2021-2024) | 7,497
No. of charges | 4,703 (63%)
For 2023/24:
Most Common Age Group | 25-34
Gender | Female (593) | Male (2,232) 78%

No. of drink-driving arrests (between 2021-2024) | 1,752
No. of charges | 1,494 (75%)
For 2023/24:
Most Common Age Group | 25-34 (21%)
Gender | Female (90) | Male (463) 78%

No. of drink-driving arrests (between 2021-2024) | 1,951
No. of charges | 1,172 (60%)
For 2023/24:
Most Common Age Group | 30-39 (47%)
Gender | Female (153) | Male (464) 75%
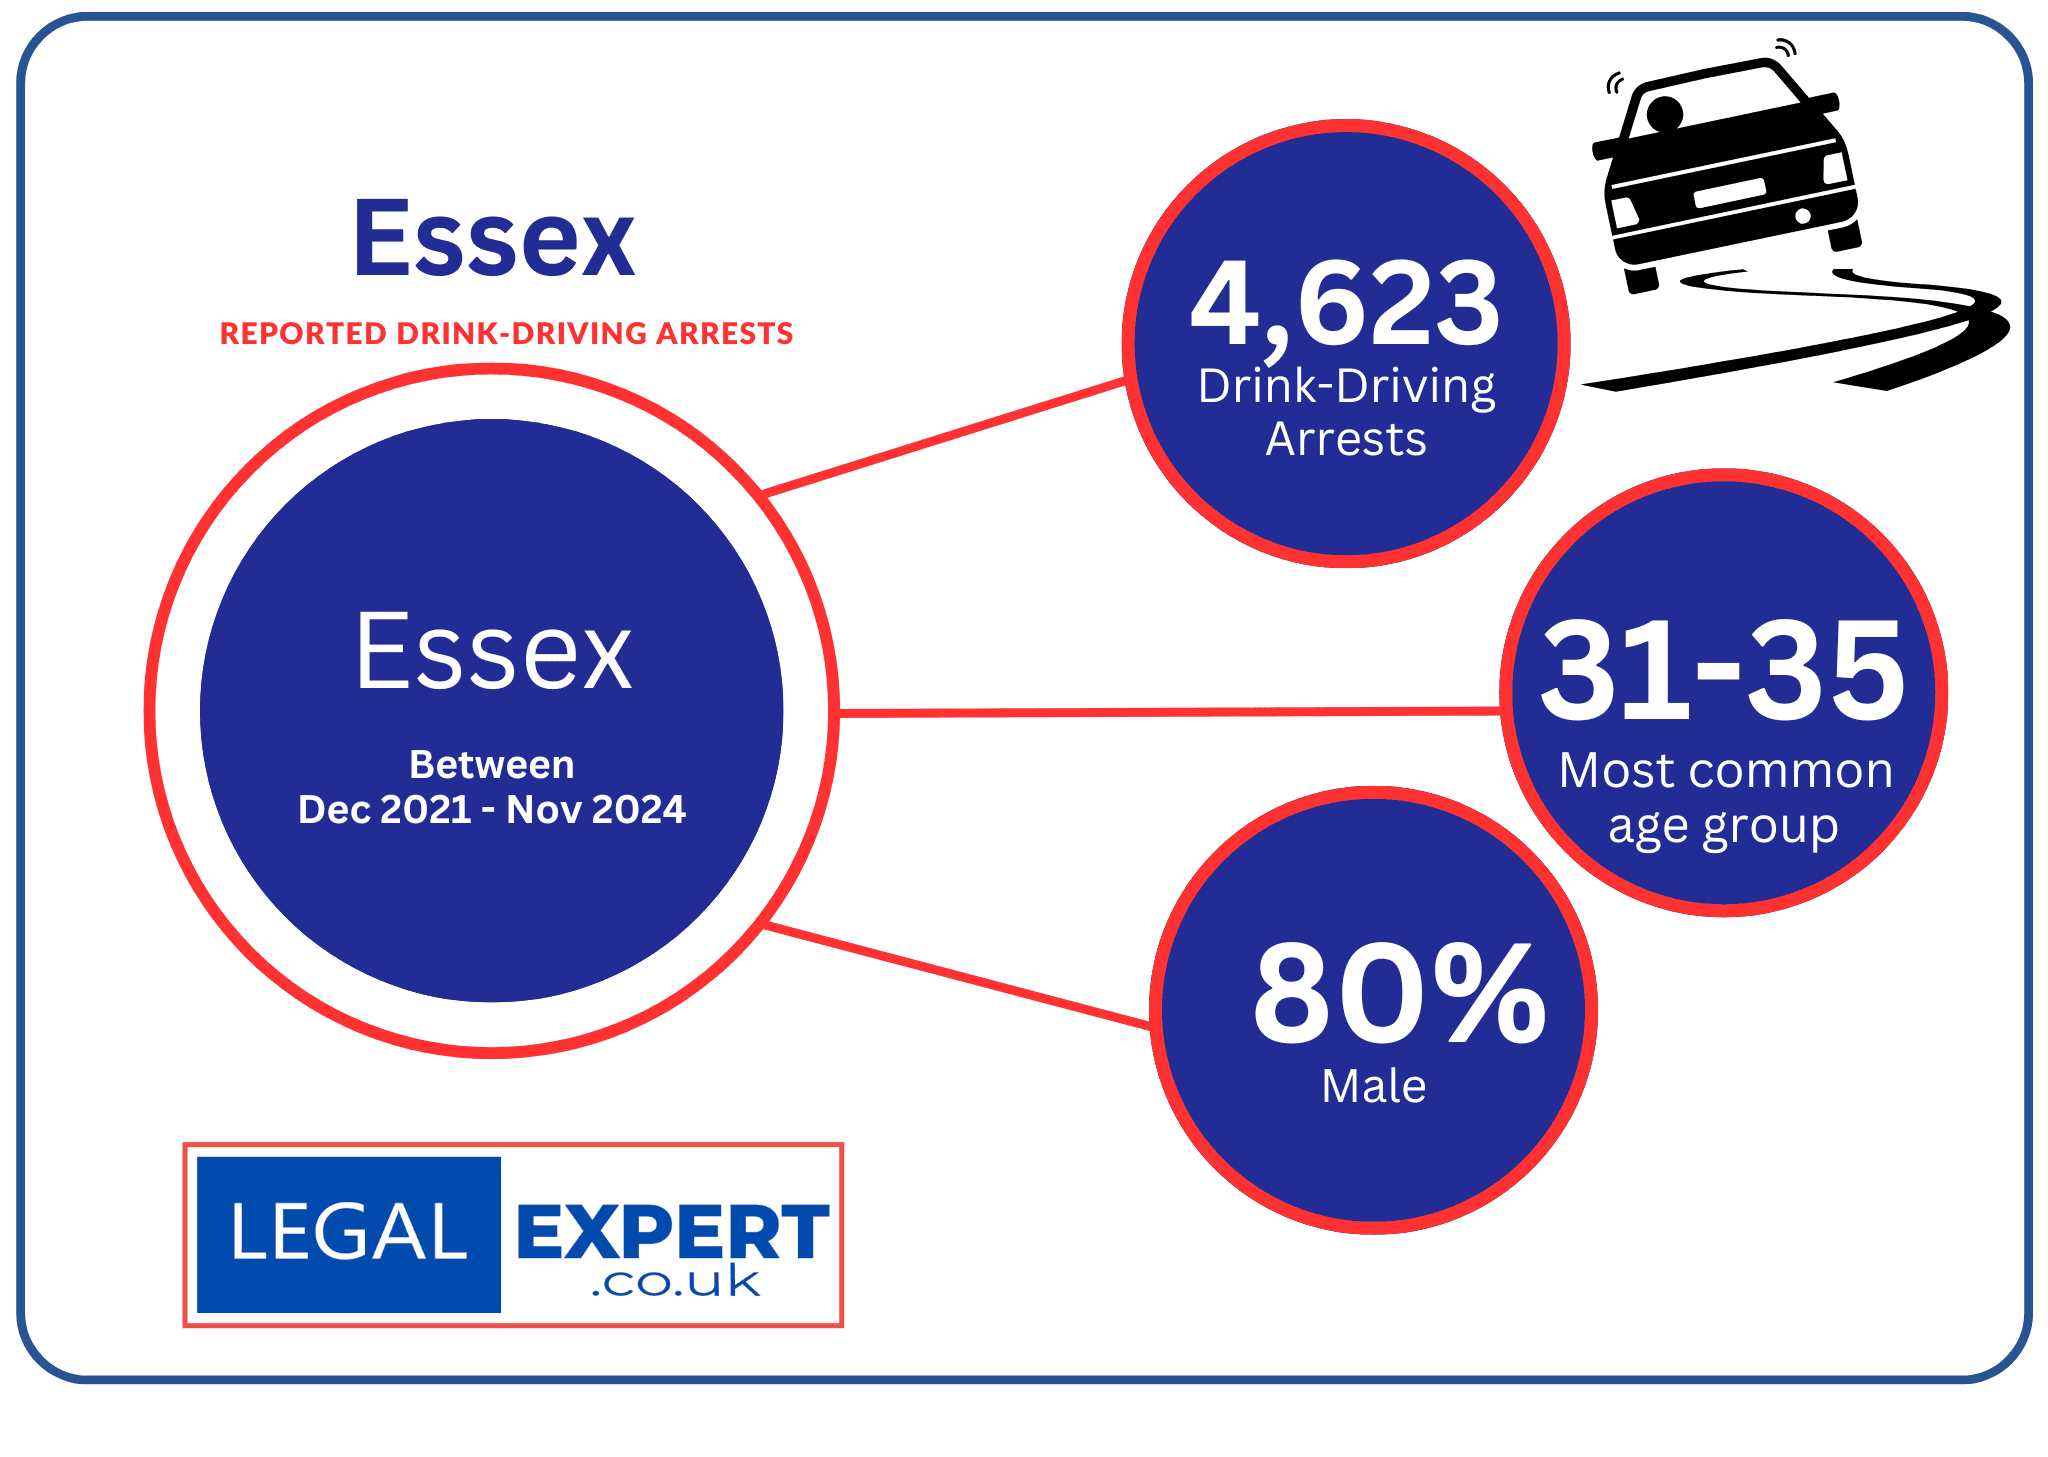
No. of drink-driving arrests (between 2021-2024) | 4,623
No. of charges | 3,071 (66%)
For 2023/24:
Most Common Age Group | 31-35 (16%)
Gender | Female (295) | Male (1,198) 80%
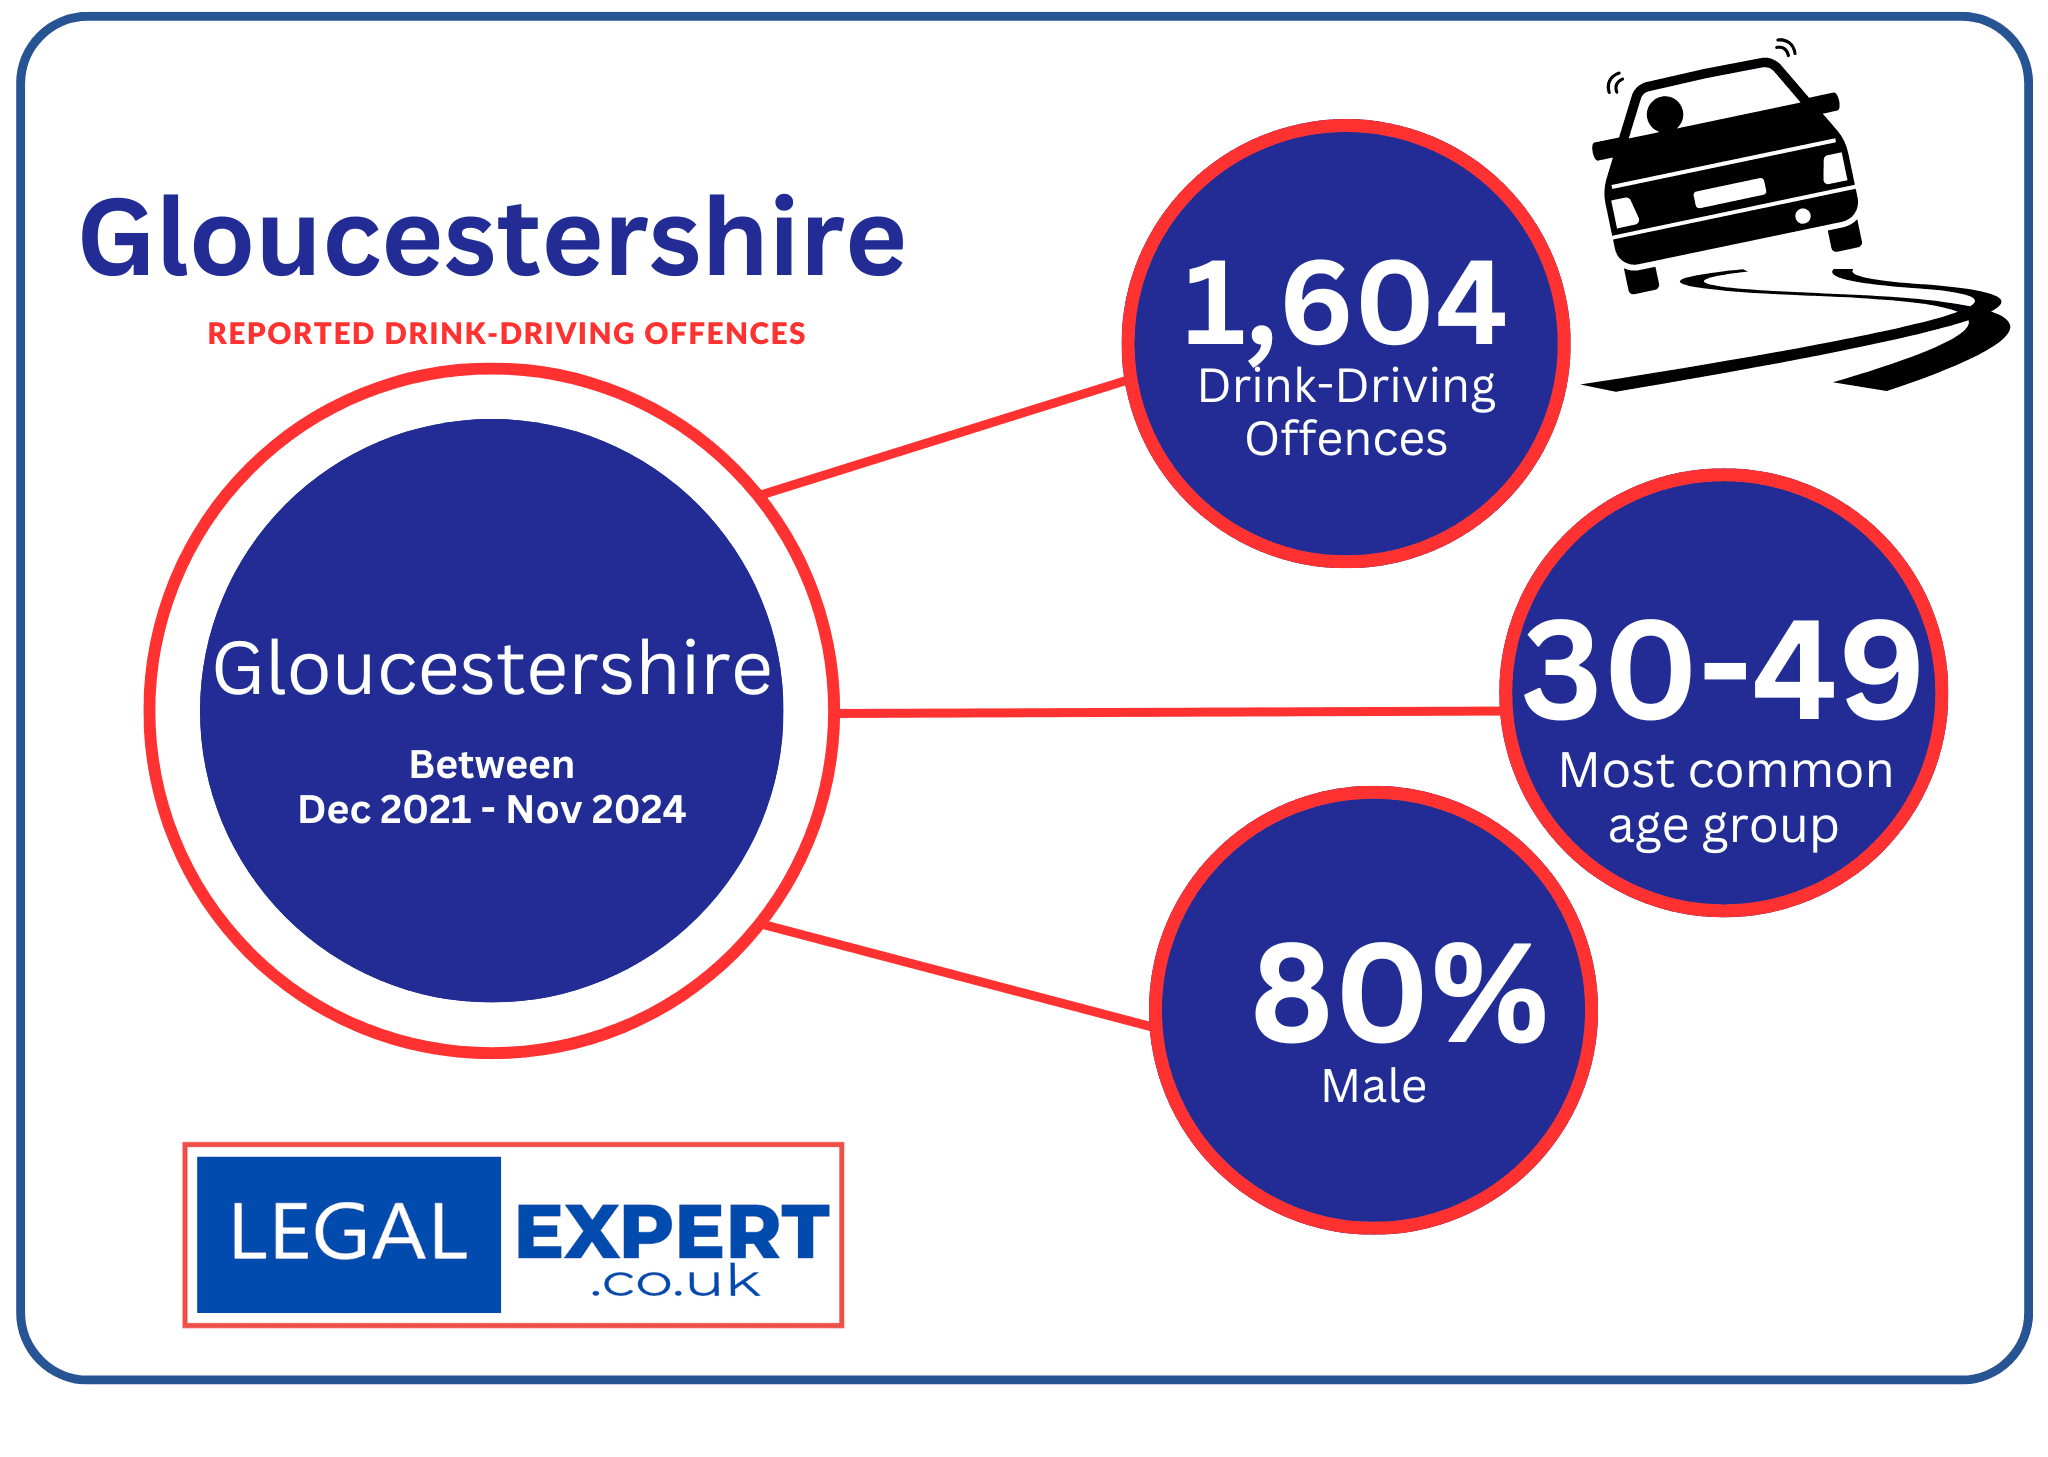
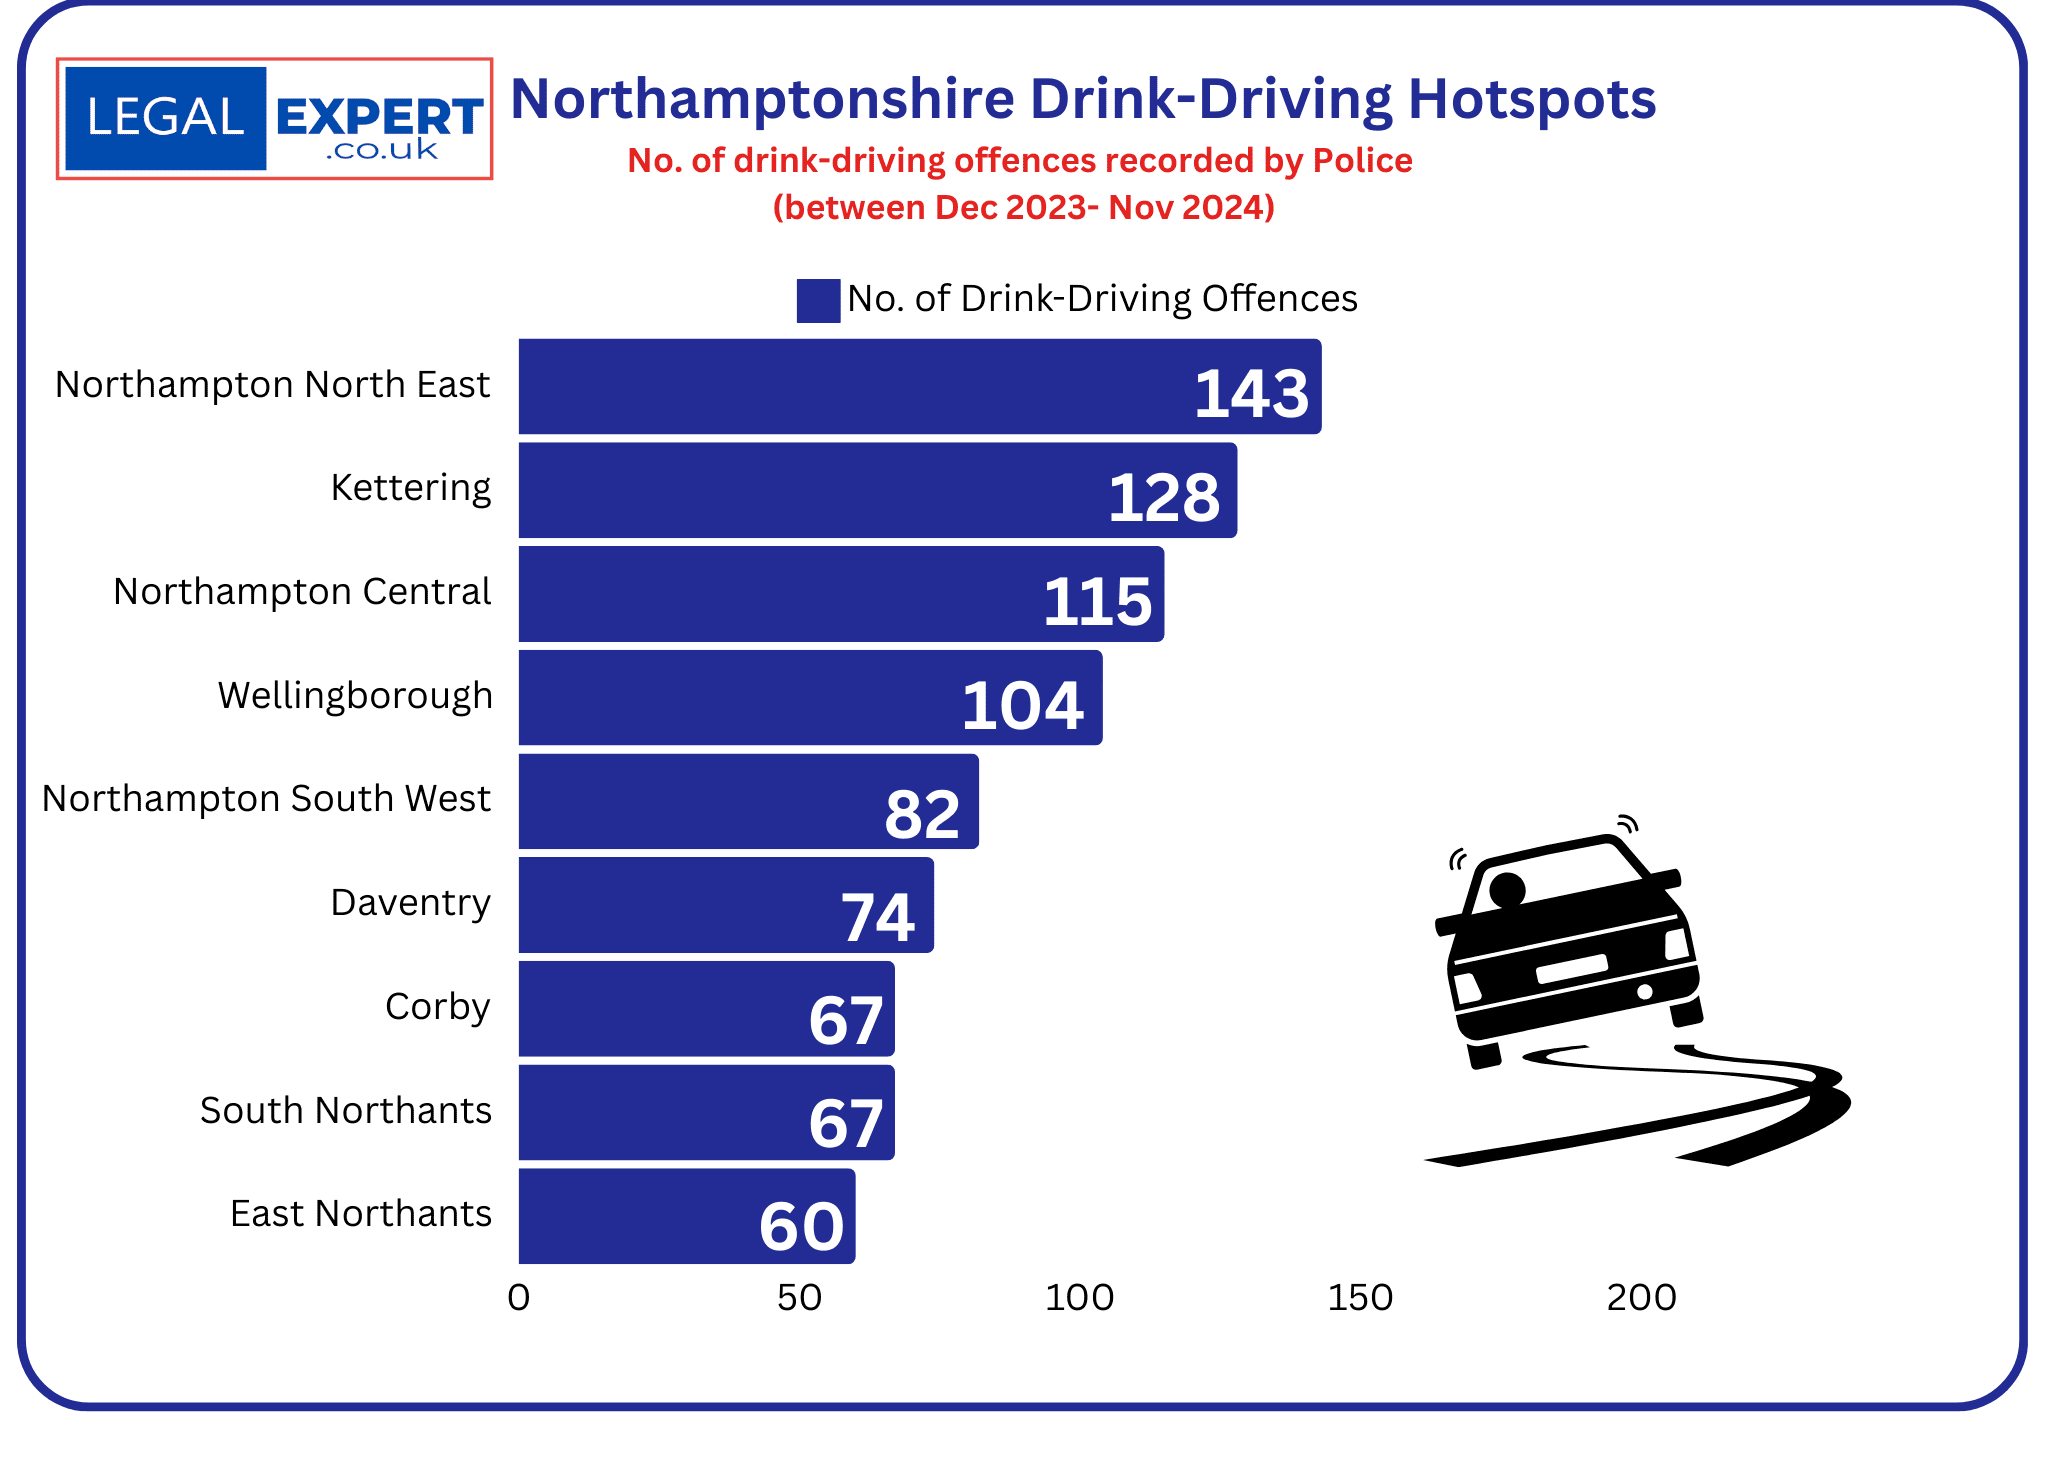
No. of drink-driving offences (between 2021-2024) | 1,604
No. of charges | 1,172
For 2023/24:
Most Common Age Group | 30-49 (49%)
Gender | Female (106) | Male (519) 80%

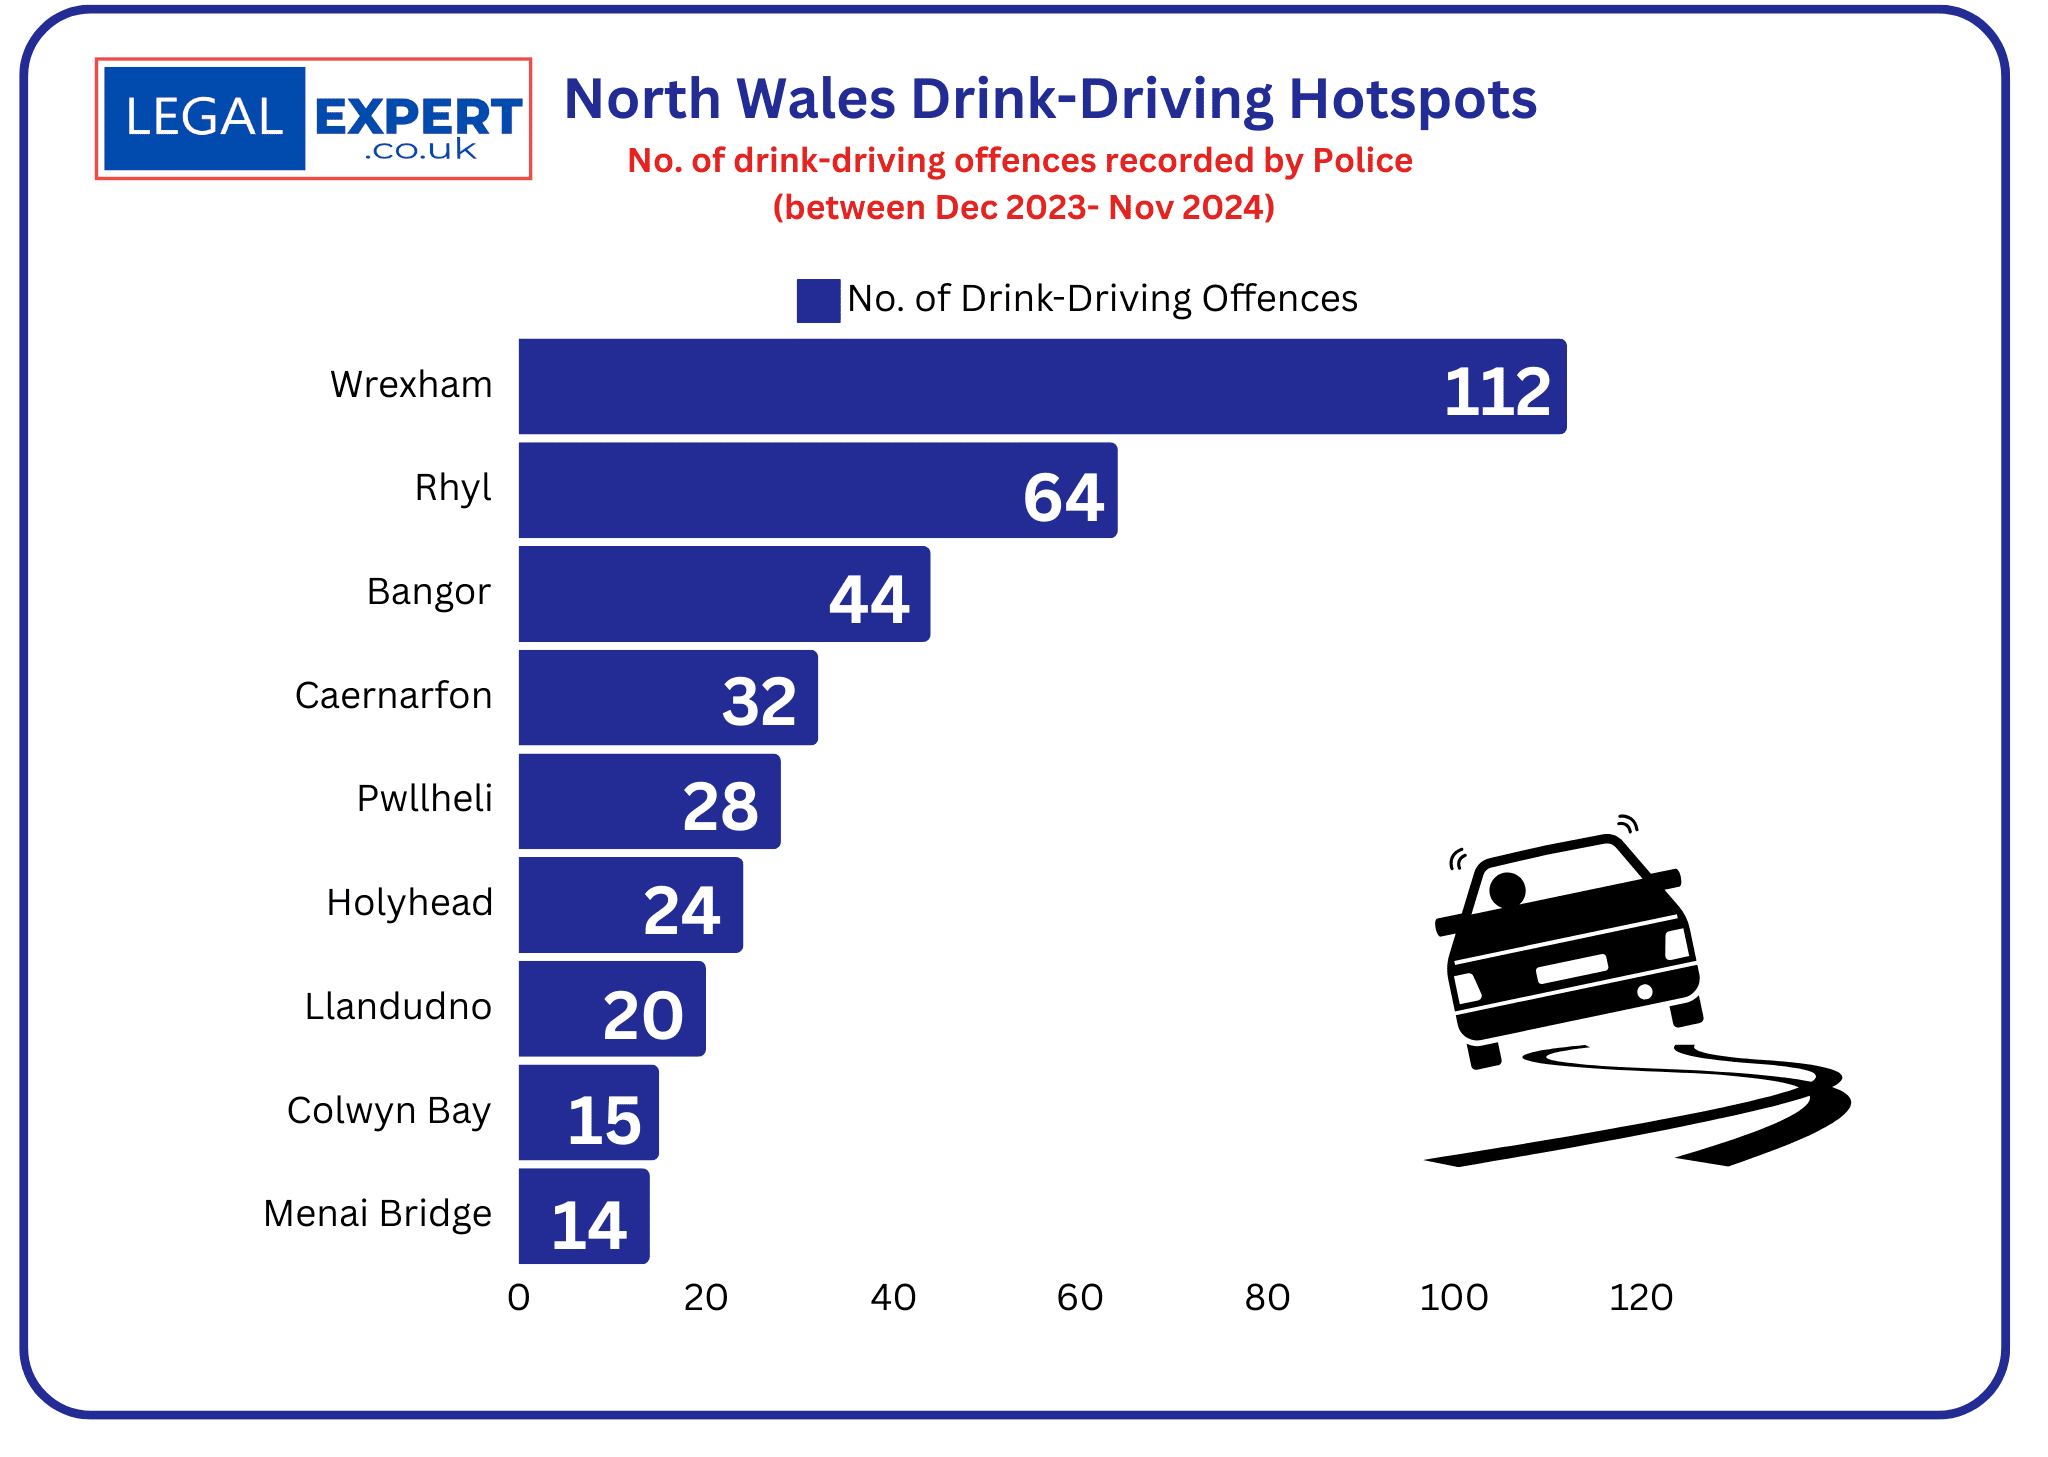
No. of drink-driving offences (between 2021-2024) | 2,008
No. of charges | 1,225 (61%)
For 2023/24:
Most Common Age Group | 26-35 (33%)
Gender | Female (69) | Male (545) 84%

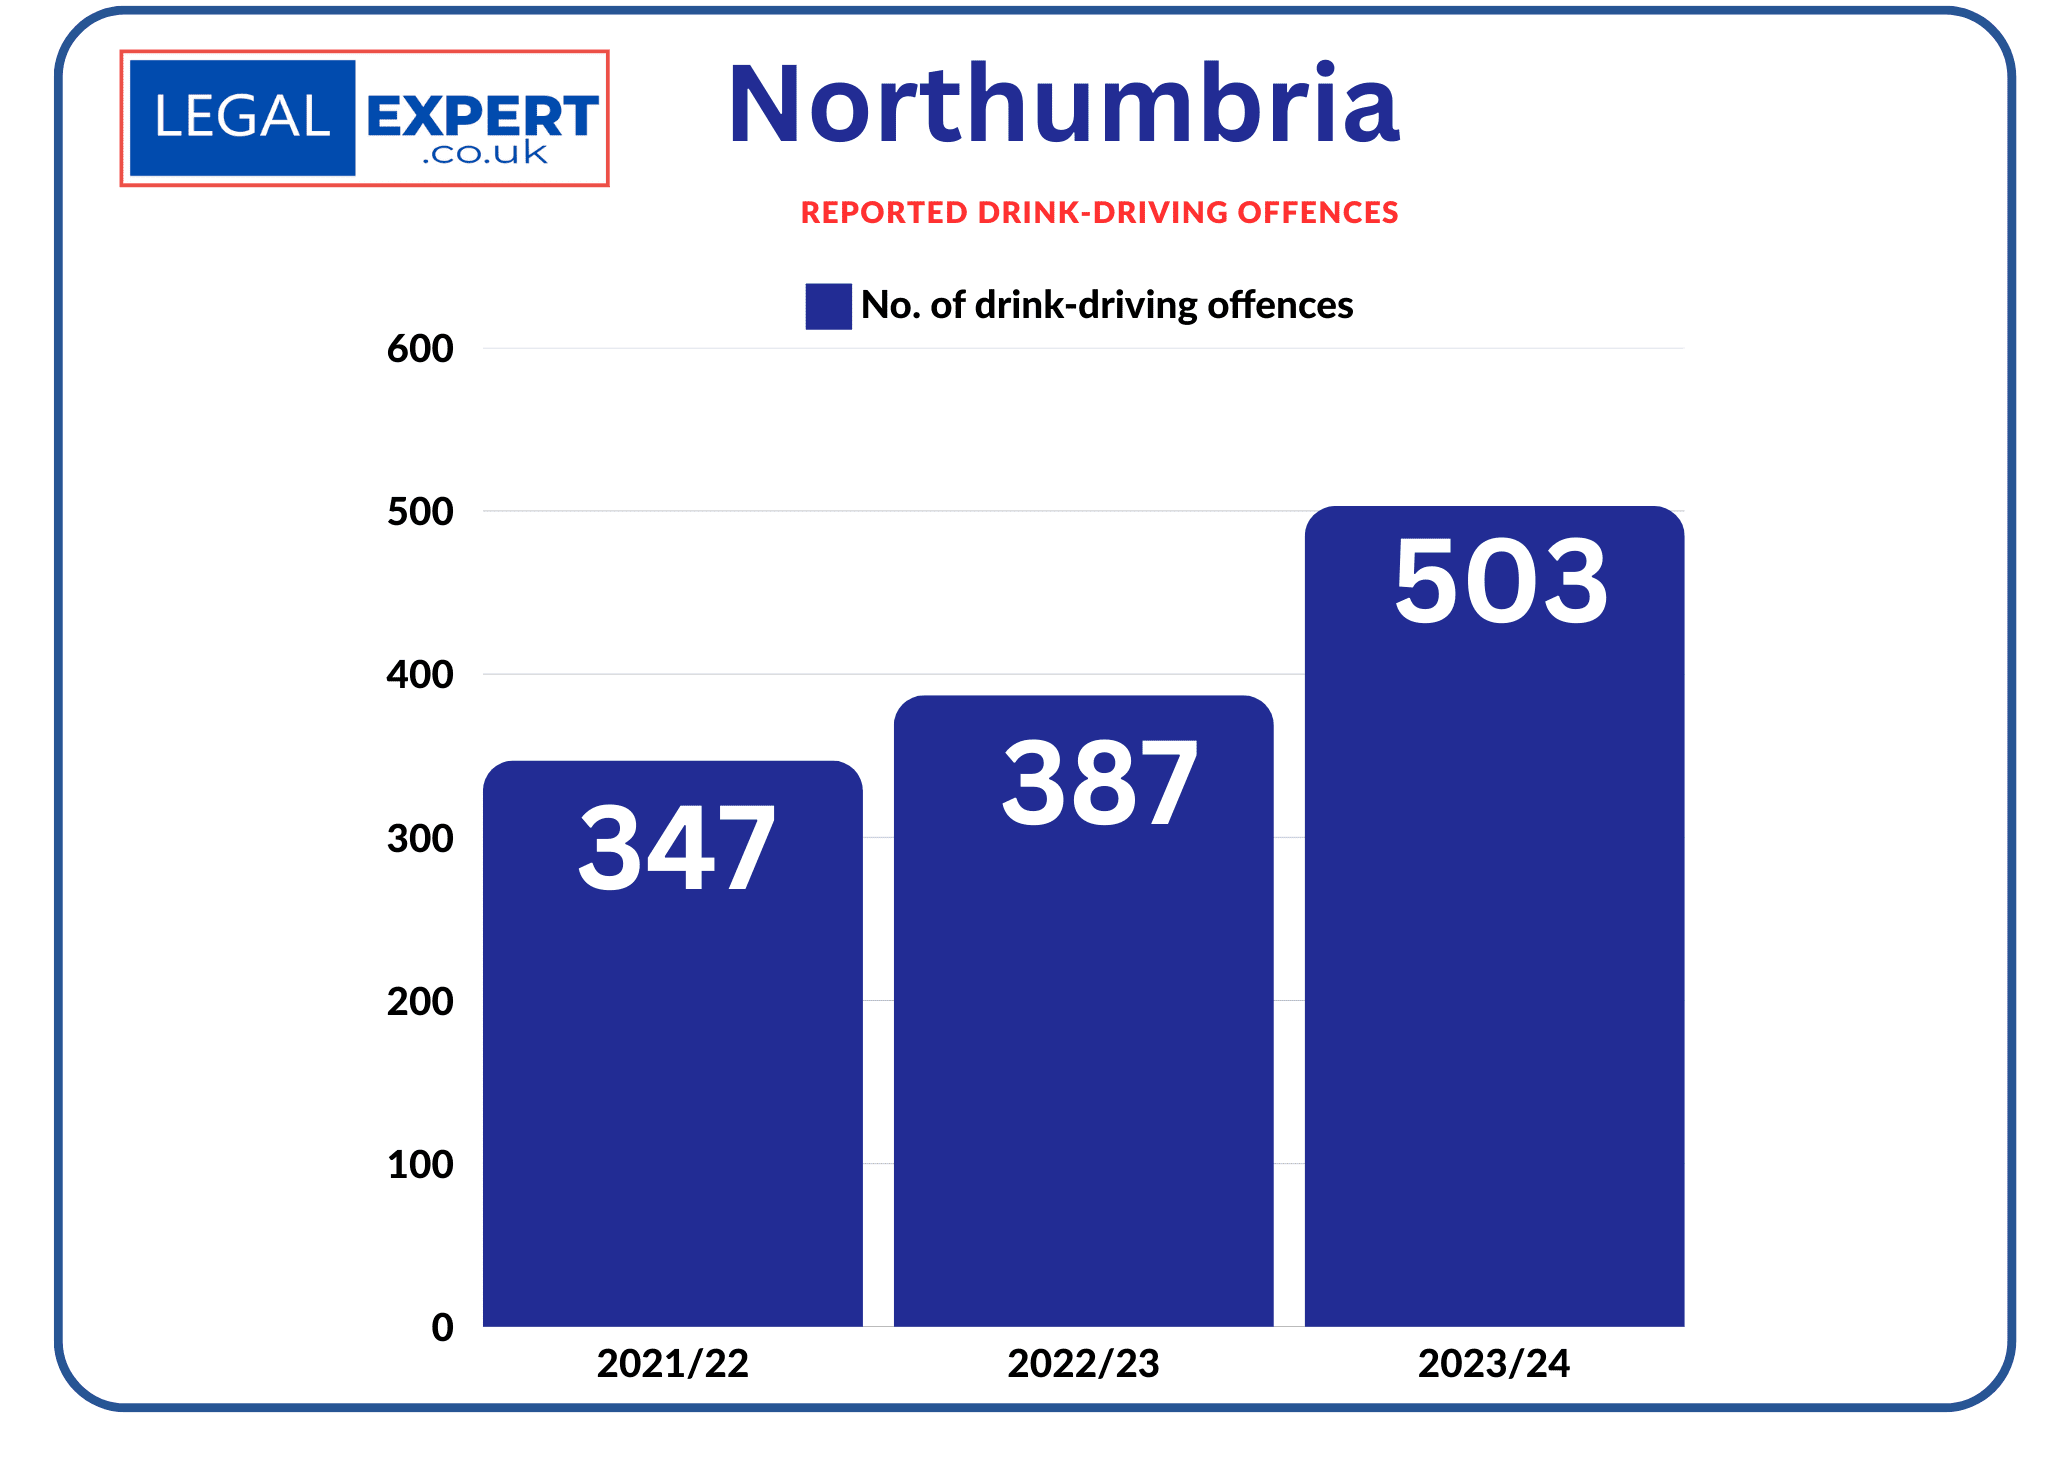
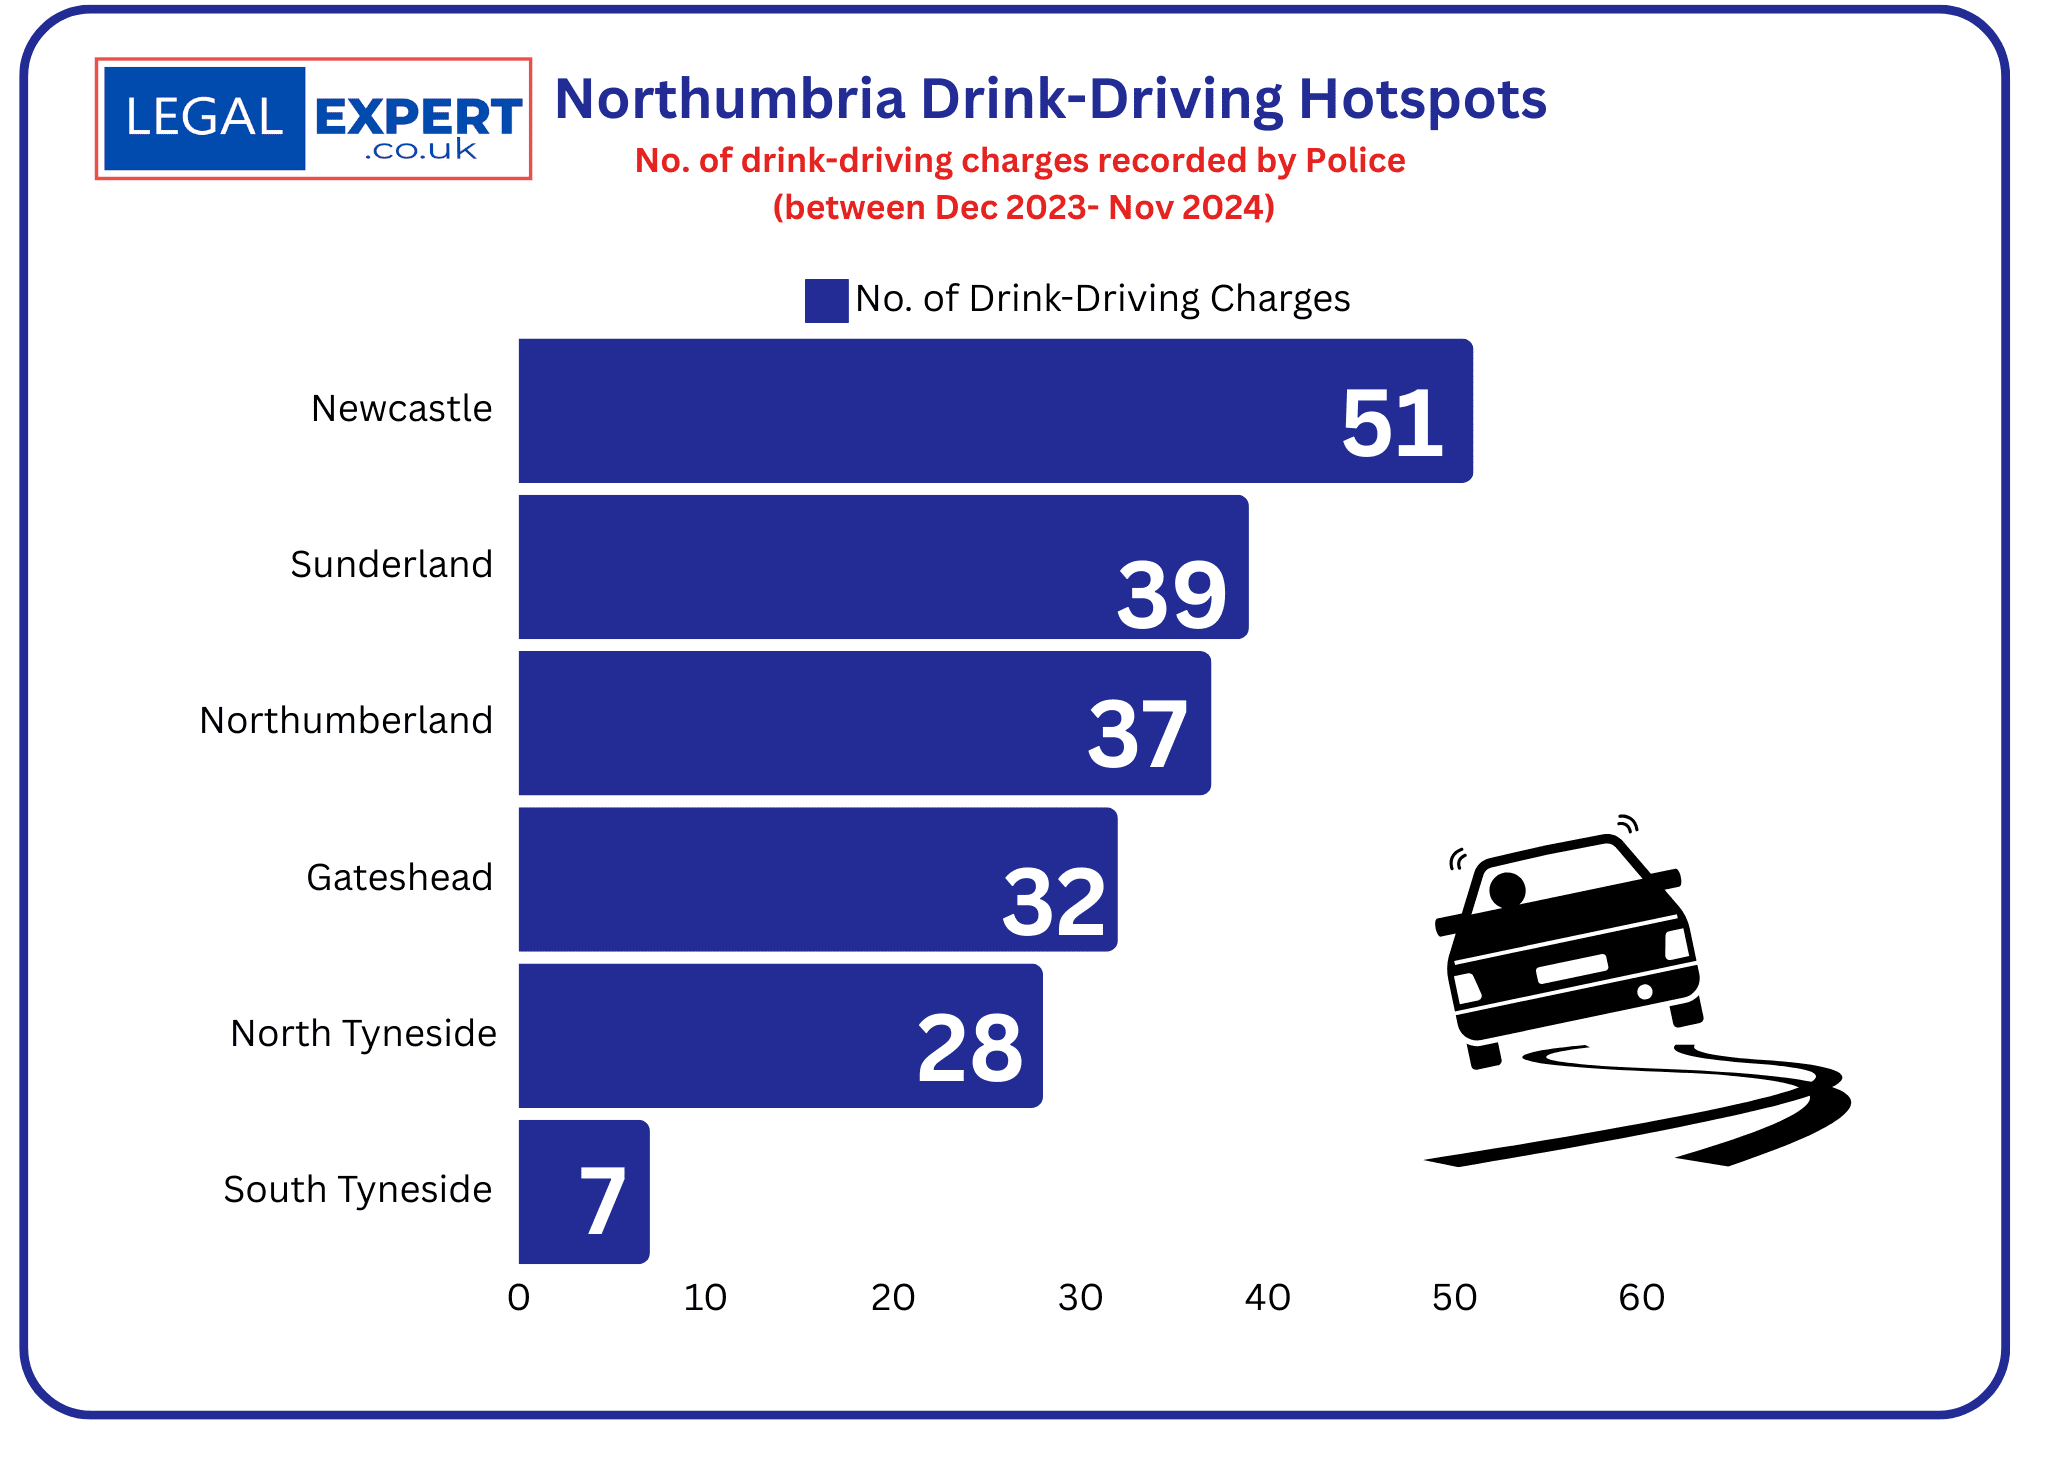
No. of drink-driving offences (between 2021-2024) | 2,621
For 2023/24:
Most Common Age Group | 25-34 (32%)
Gender | Female (115) | Male (478) 81%

No. of drink-driving offences (between 2021-2024) | 4,948
For 2023/24:
Most Common Age Group | 31-40 (32%)
Gender | Female (985) | Male (3937) 80%

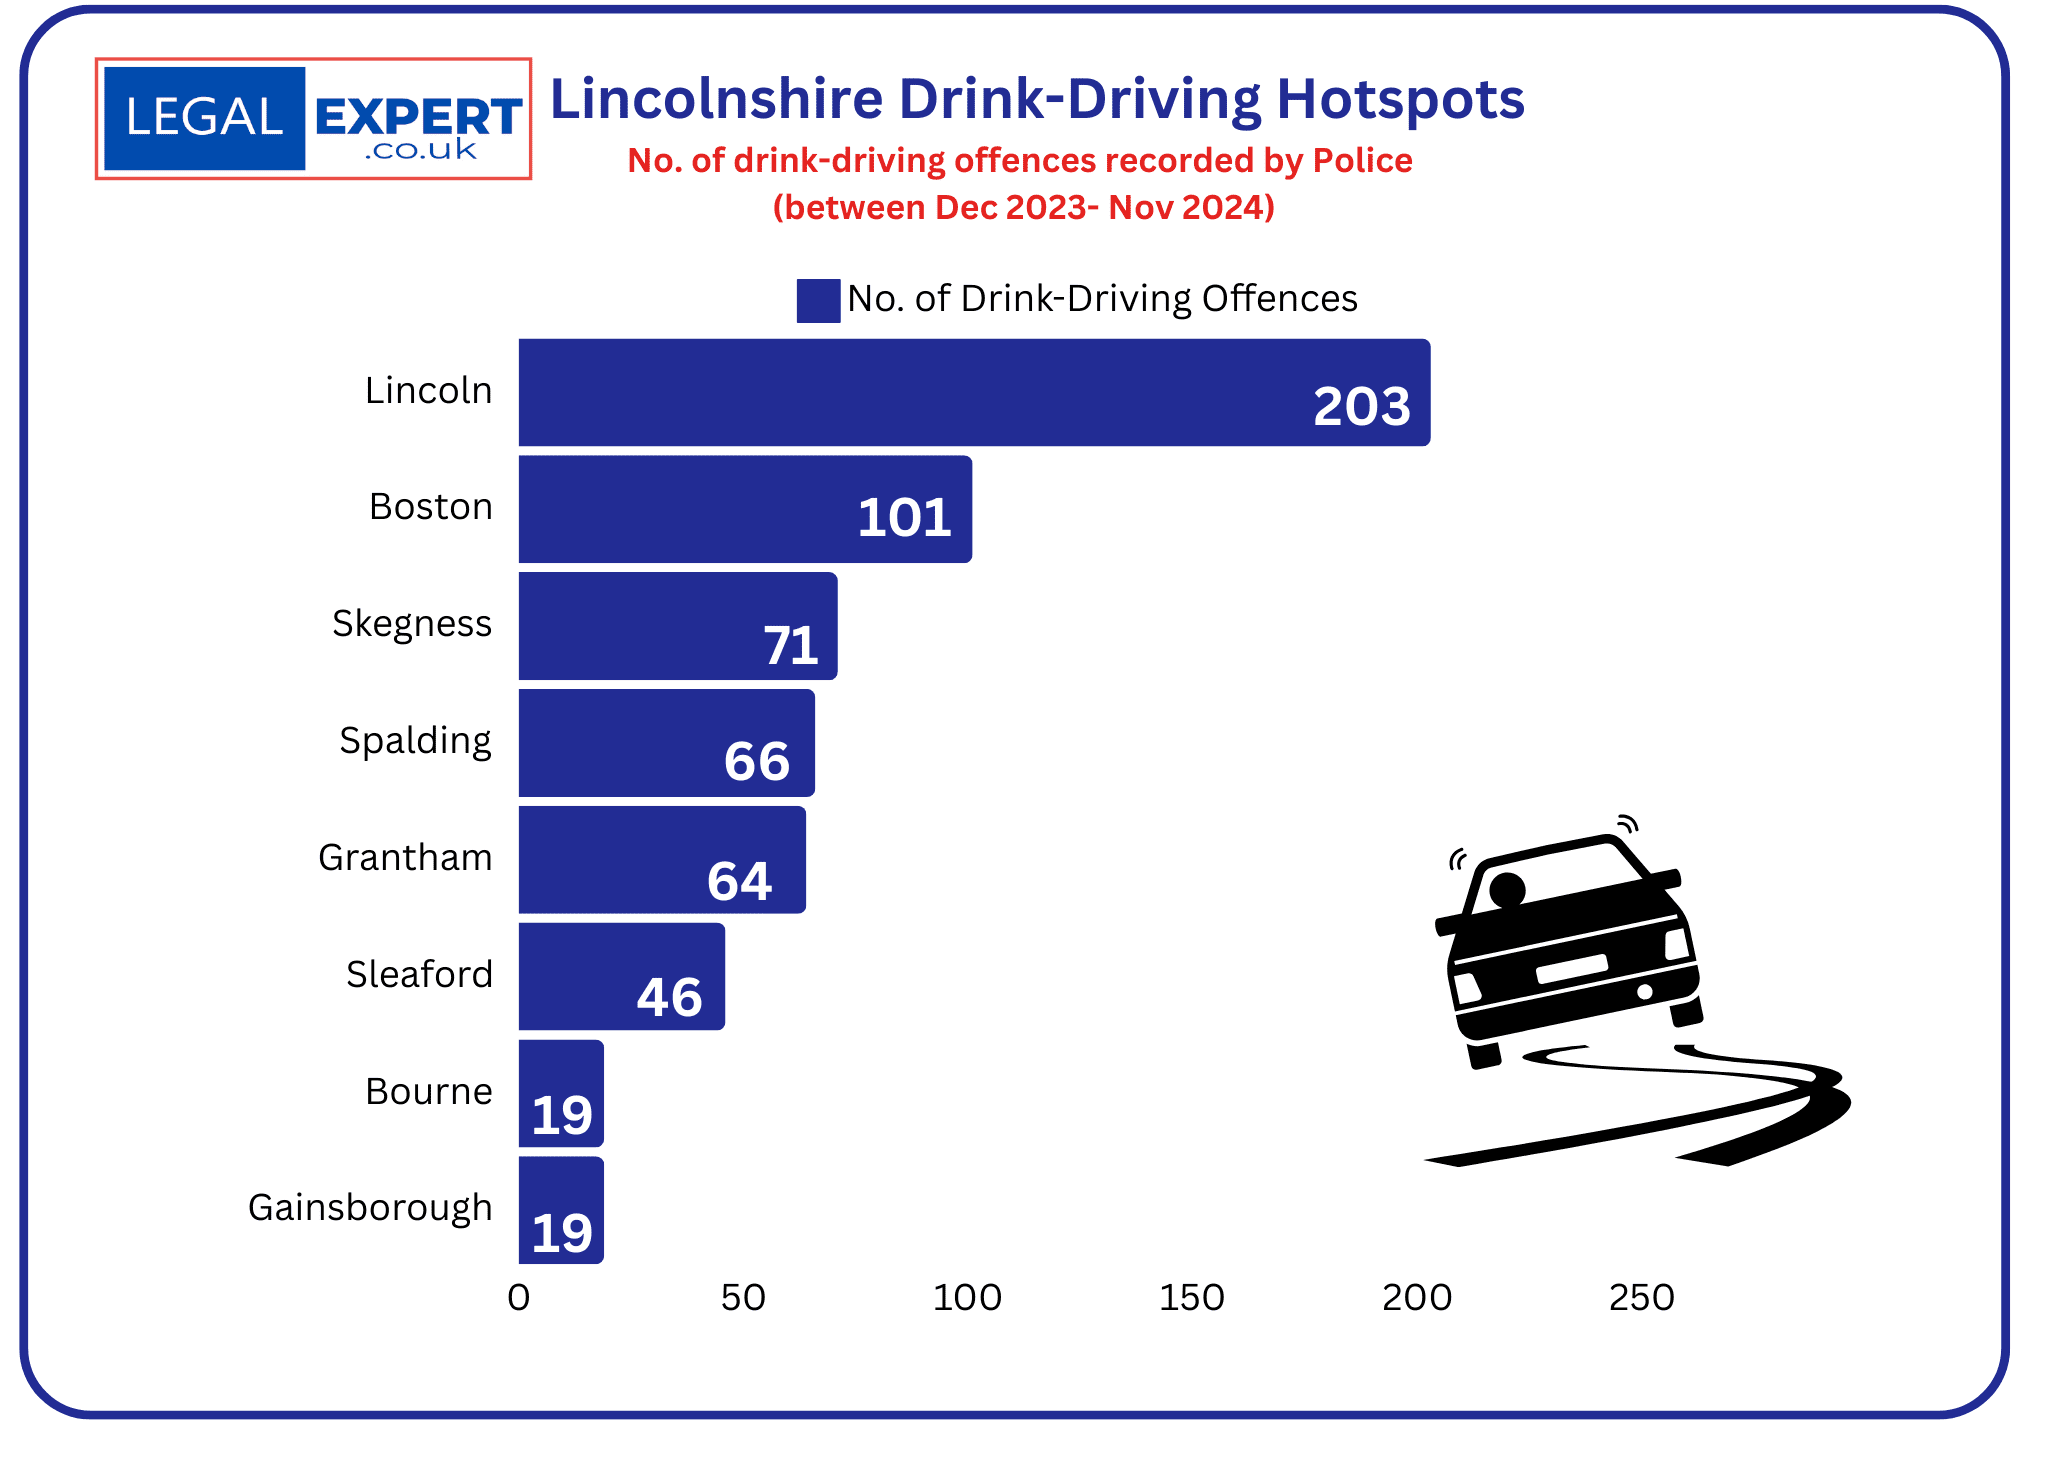
No. of drink-driving offences (between 2021-2024) | 2,488
No. of charges | 1,878 (75%)
For 2023/24:
Most Common Age Group | 46-55 (42%)
Gender | Female (133) | Male (638) 81%
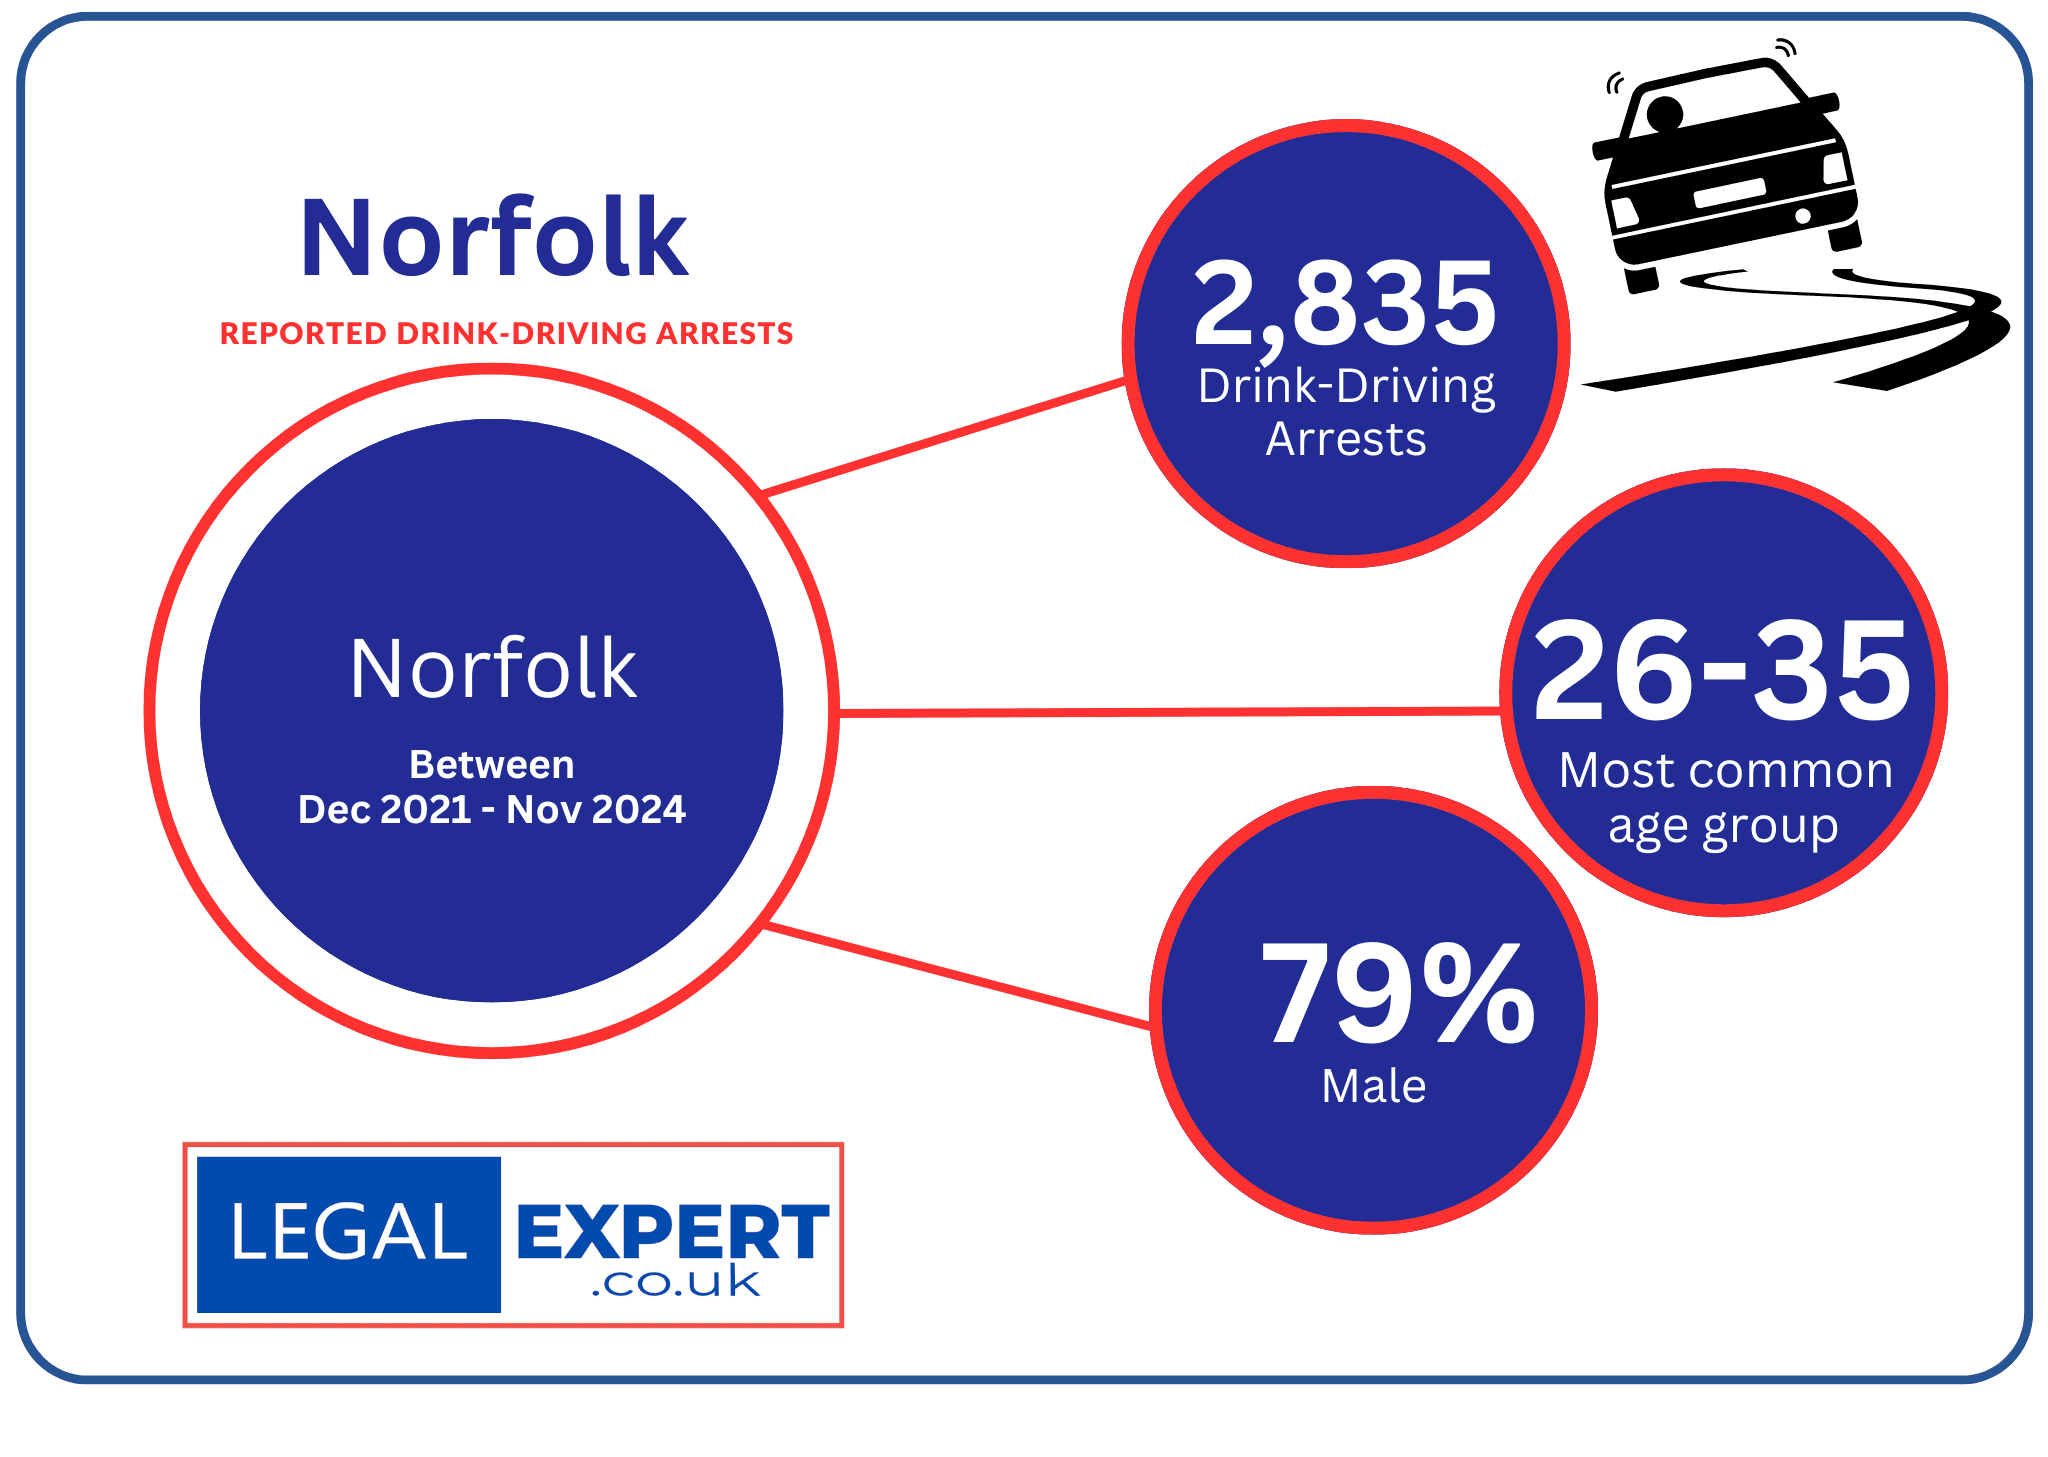
No. of drink-driving offences (between 2021-2024) | 2,835
No. of charges | 1,752 (62%)
For 2023/24:
Most Common Age Group | 26-35 (30%)
Gender | Female (178) | Male (680) 79%
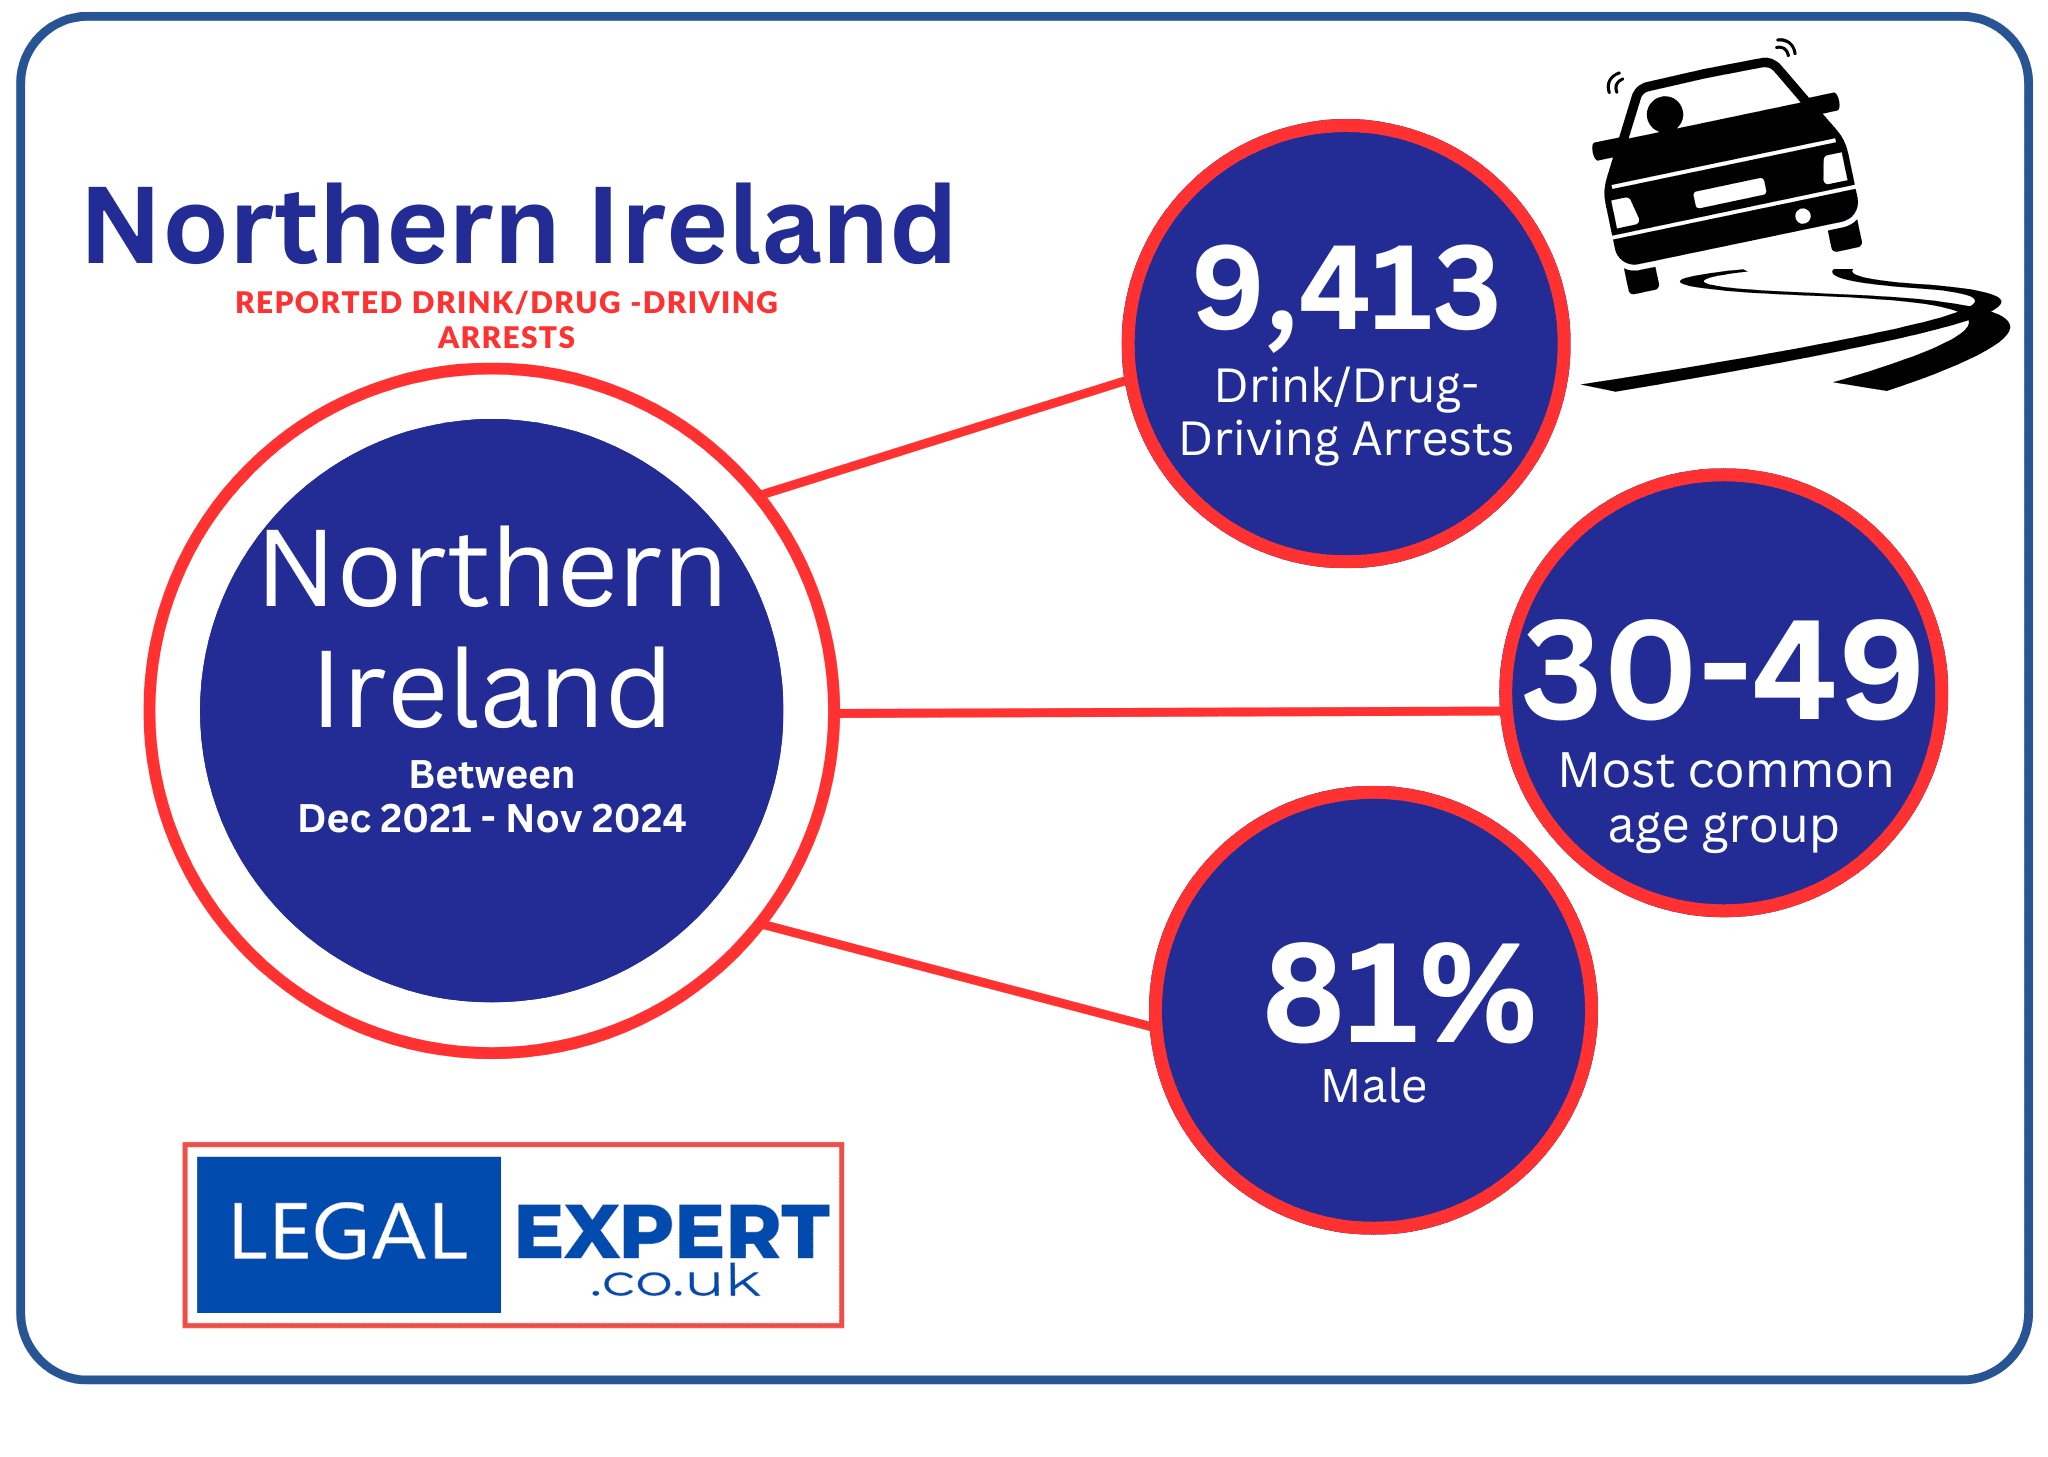
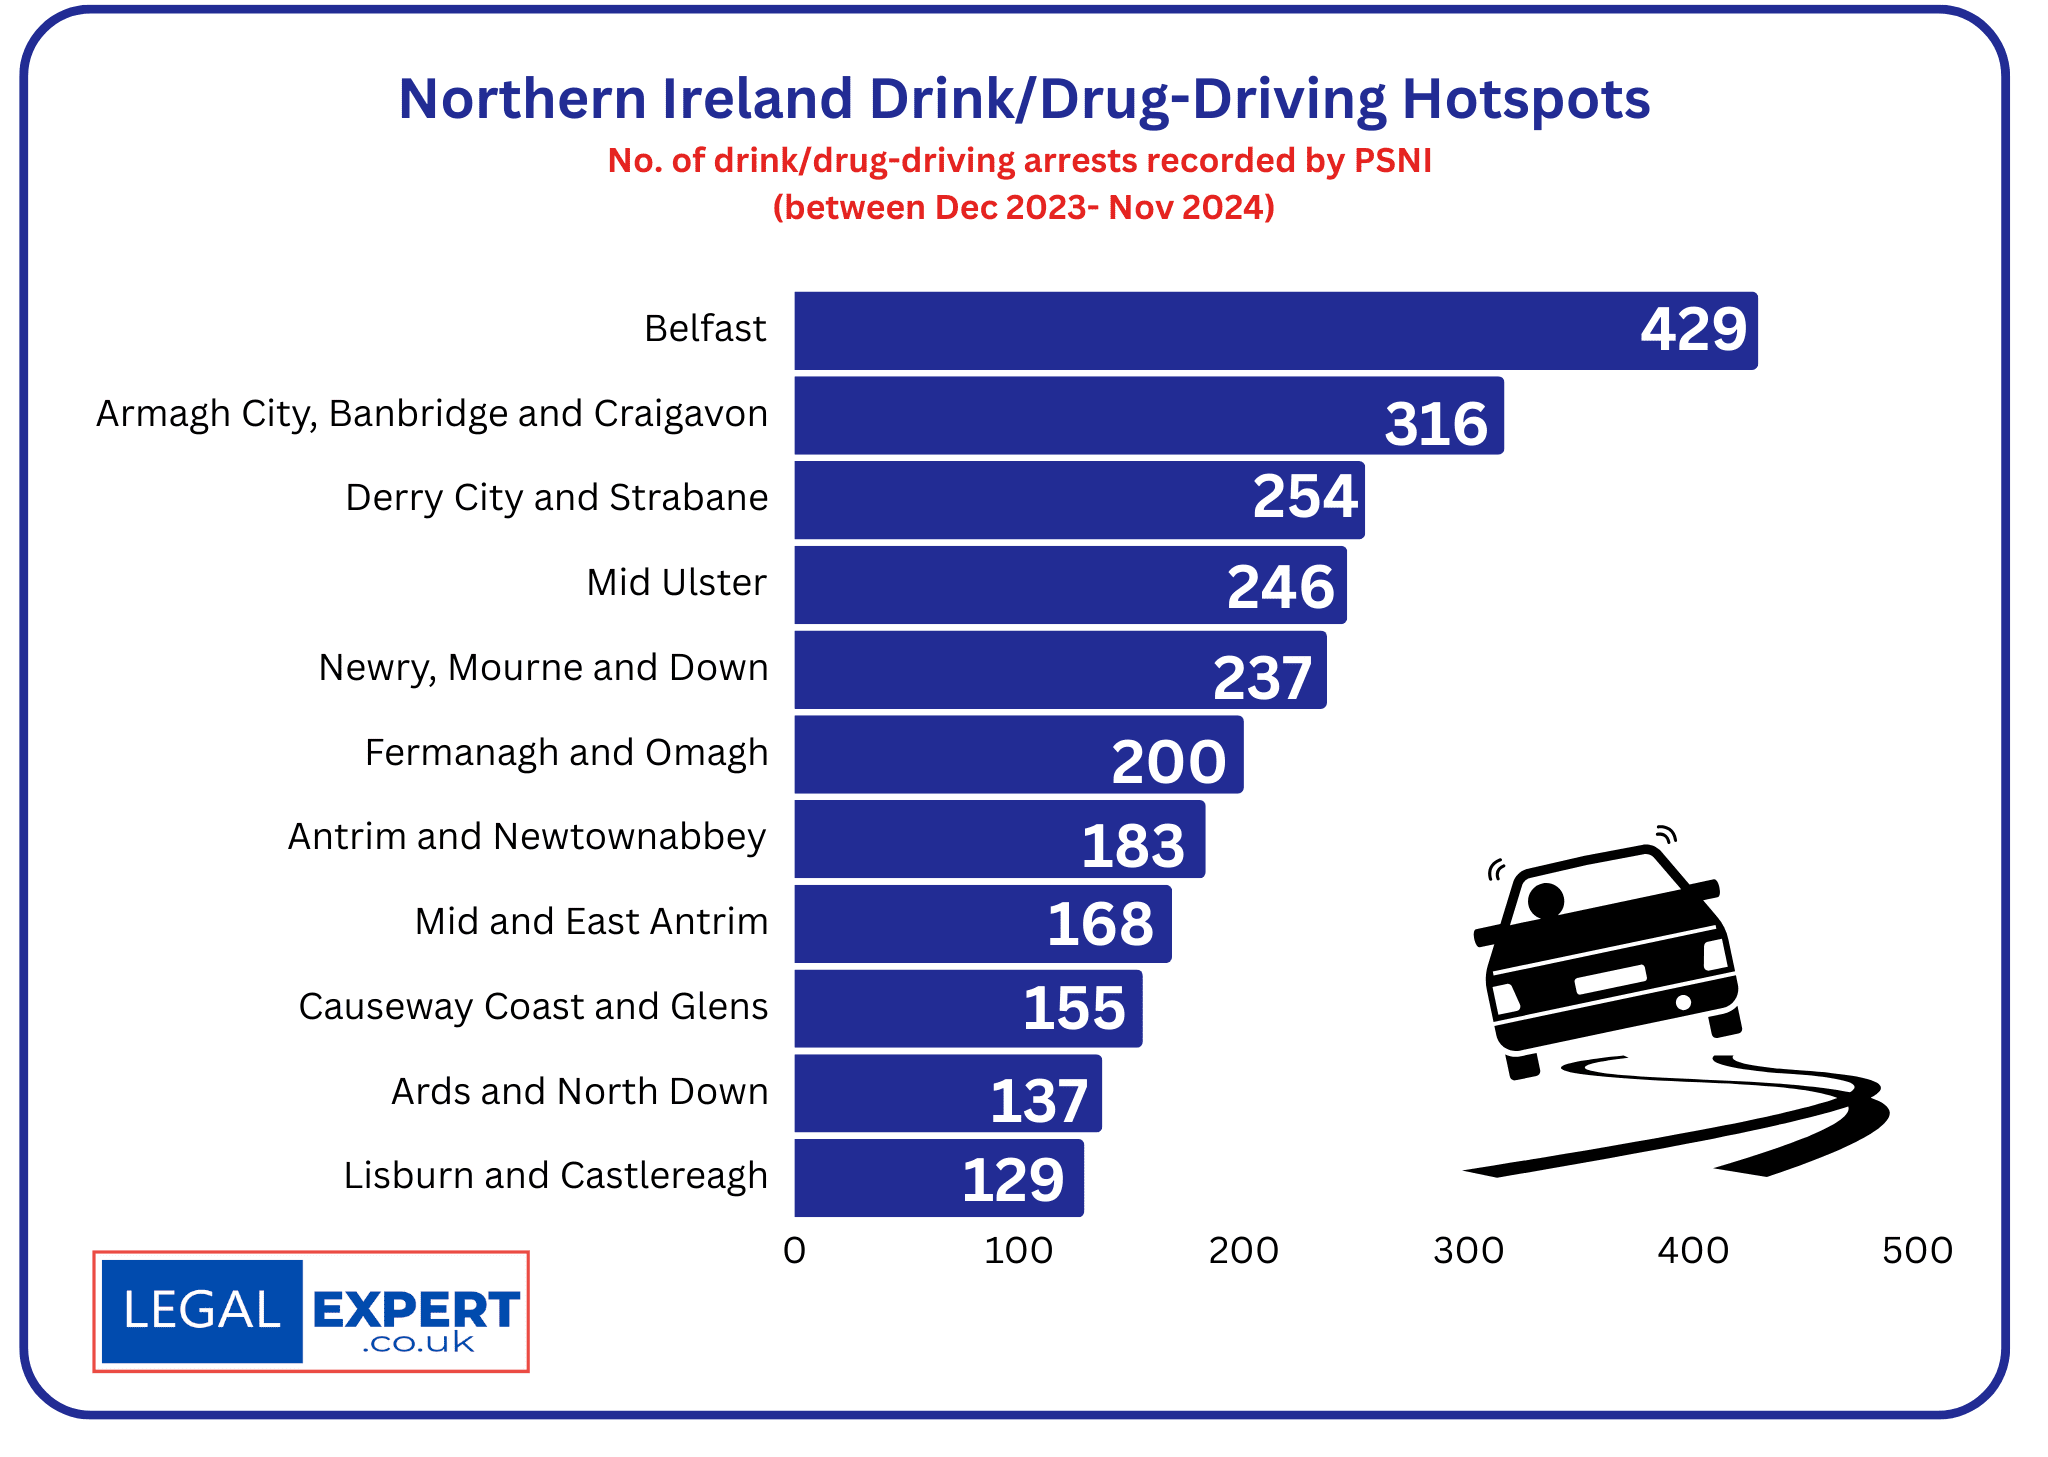
No. of drink-driving arrests (between 2021-2024) | 9,413
No. of charges | 7,805 (83%)
For 2023/24:
Most Common Age Group | 30-49 (55%)
Gender | Female (494) | Male (2080) 81%

No. of drink-driving arrests (between 2021-2024) | 2,936
No. of charges | 2,221 (76%)
For 2023/24:
Most Common Age Group | 26-35
Gender | Female (135) | Male (786) 85%
No. of drink-driving offences (between 2021-2024) | 1,237
No. of charges | 505 (41%)
For 2023/24:
Most Common Age Group | 26-30 (14%)
Gender | Female (34) | Male (160) 82%

No. of drink-driving offences (between 2021-2024) | 2,766
No. of charges | 645 (23%)
For 2023/24:
Most Common Age Group | 36-45 (37%)
Gender | Female (166) | Male (595) 78%
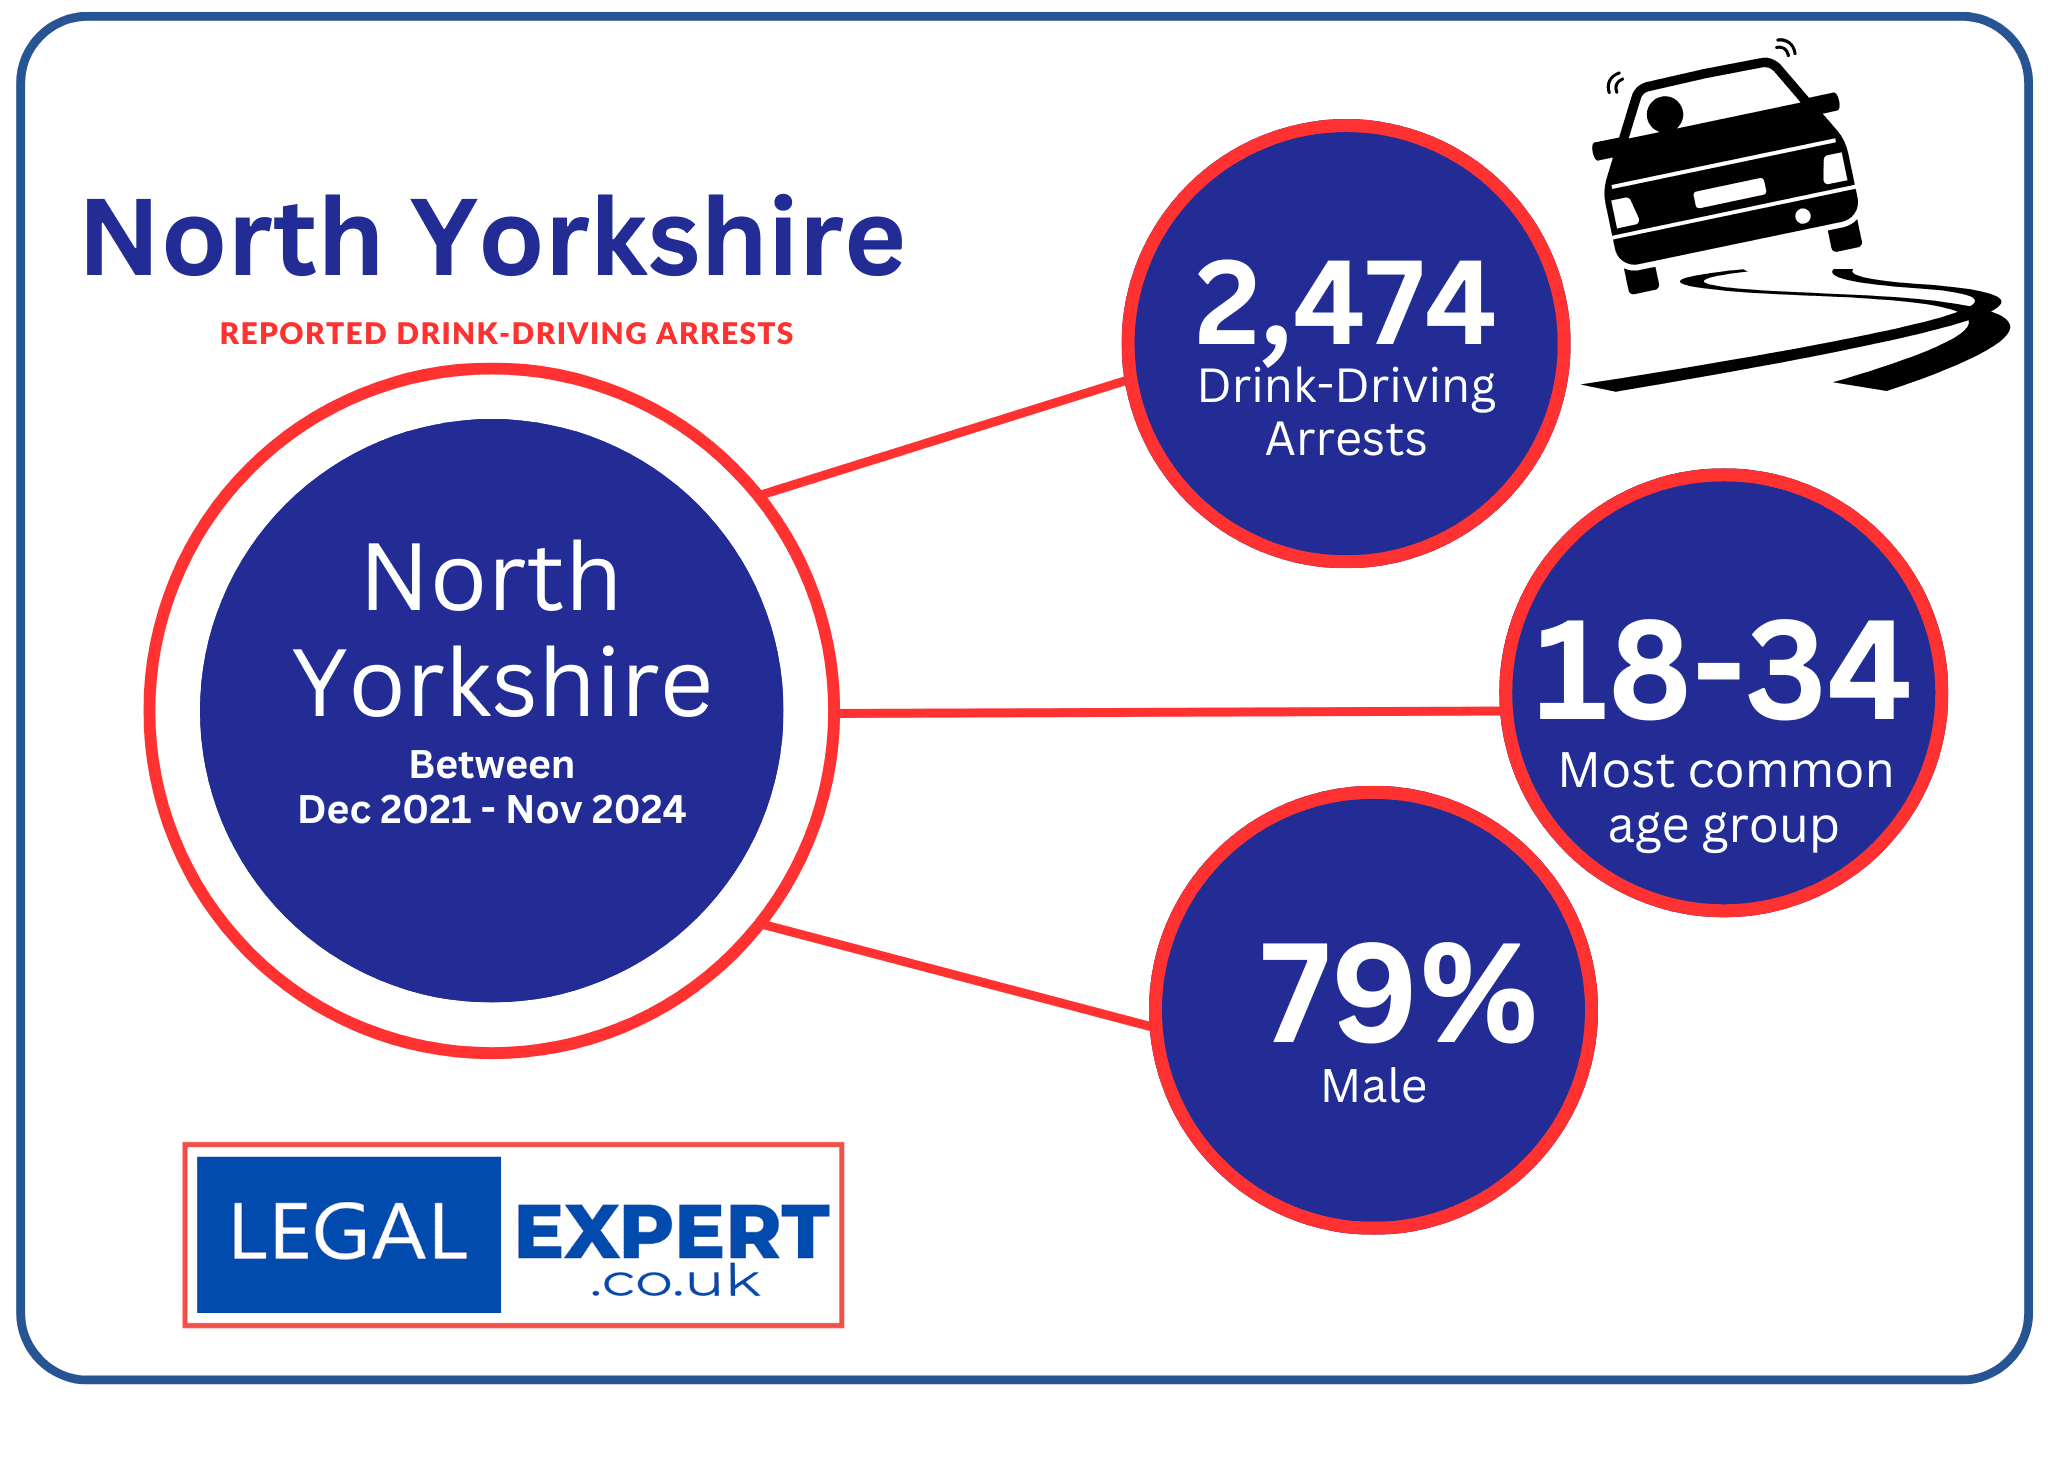
No. of drink-driving offences (between 2021-2024) | 2,474
No. of charges | 1,687 (76%)
Most Common Age Group | 18-34 (47%)
Gender | Female (495) | Male (1,950) 79%
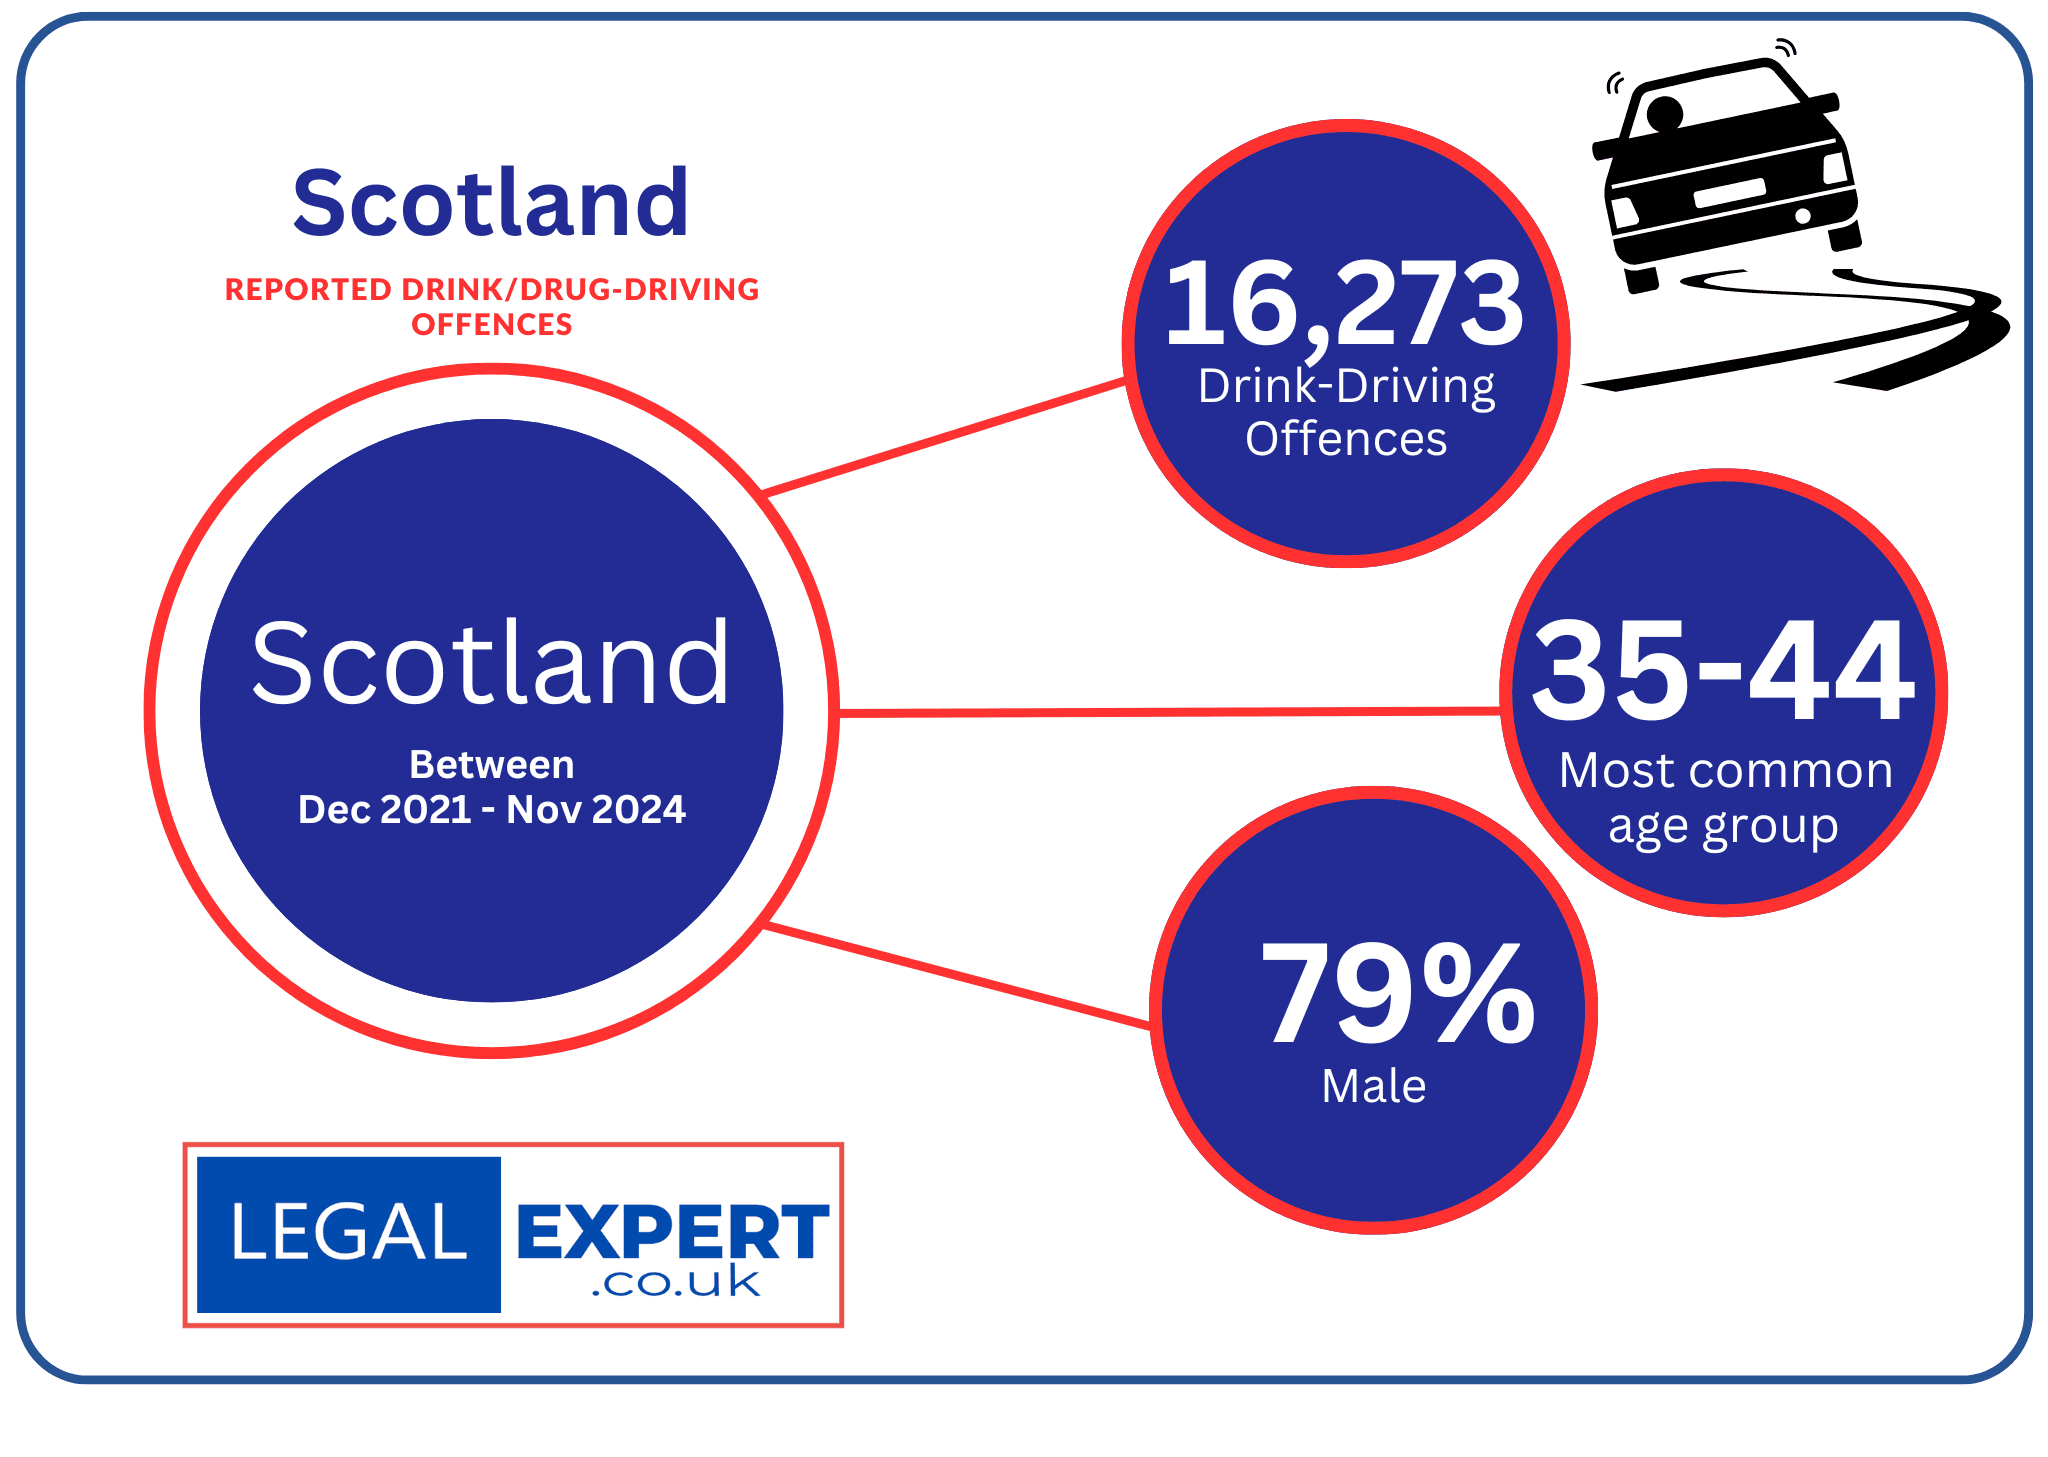
No. of drink/drug-driving offences (between 2021-2024) | 16,273
Most Common Age Group | 35-44 (29%)
Gender | Female (1,042) | Male (4,002) 79%

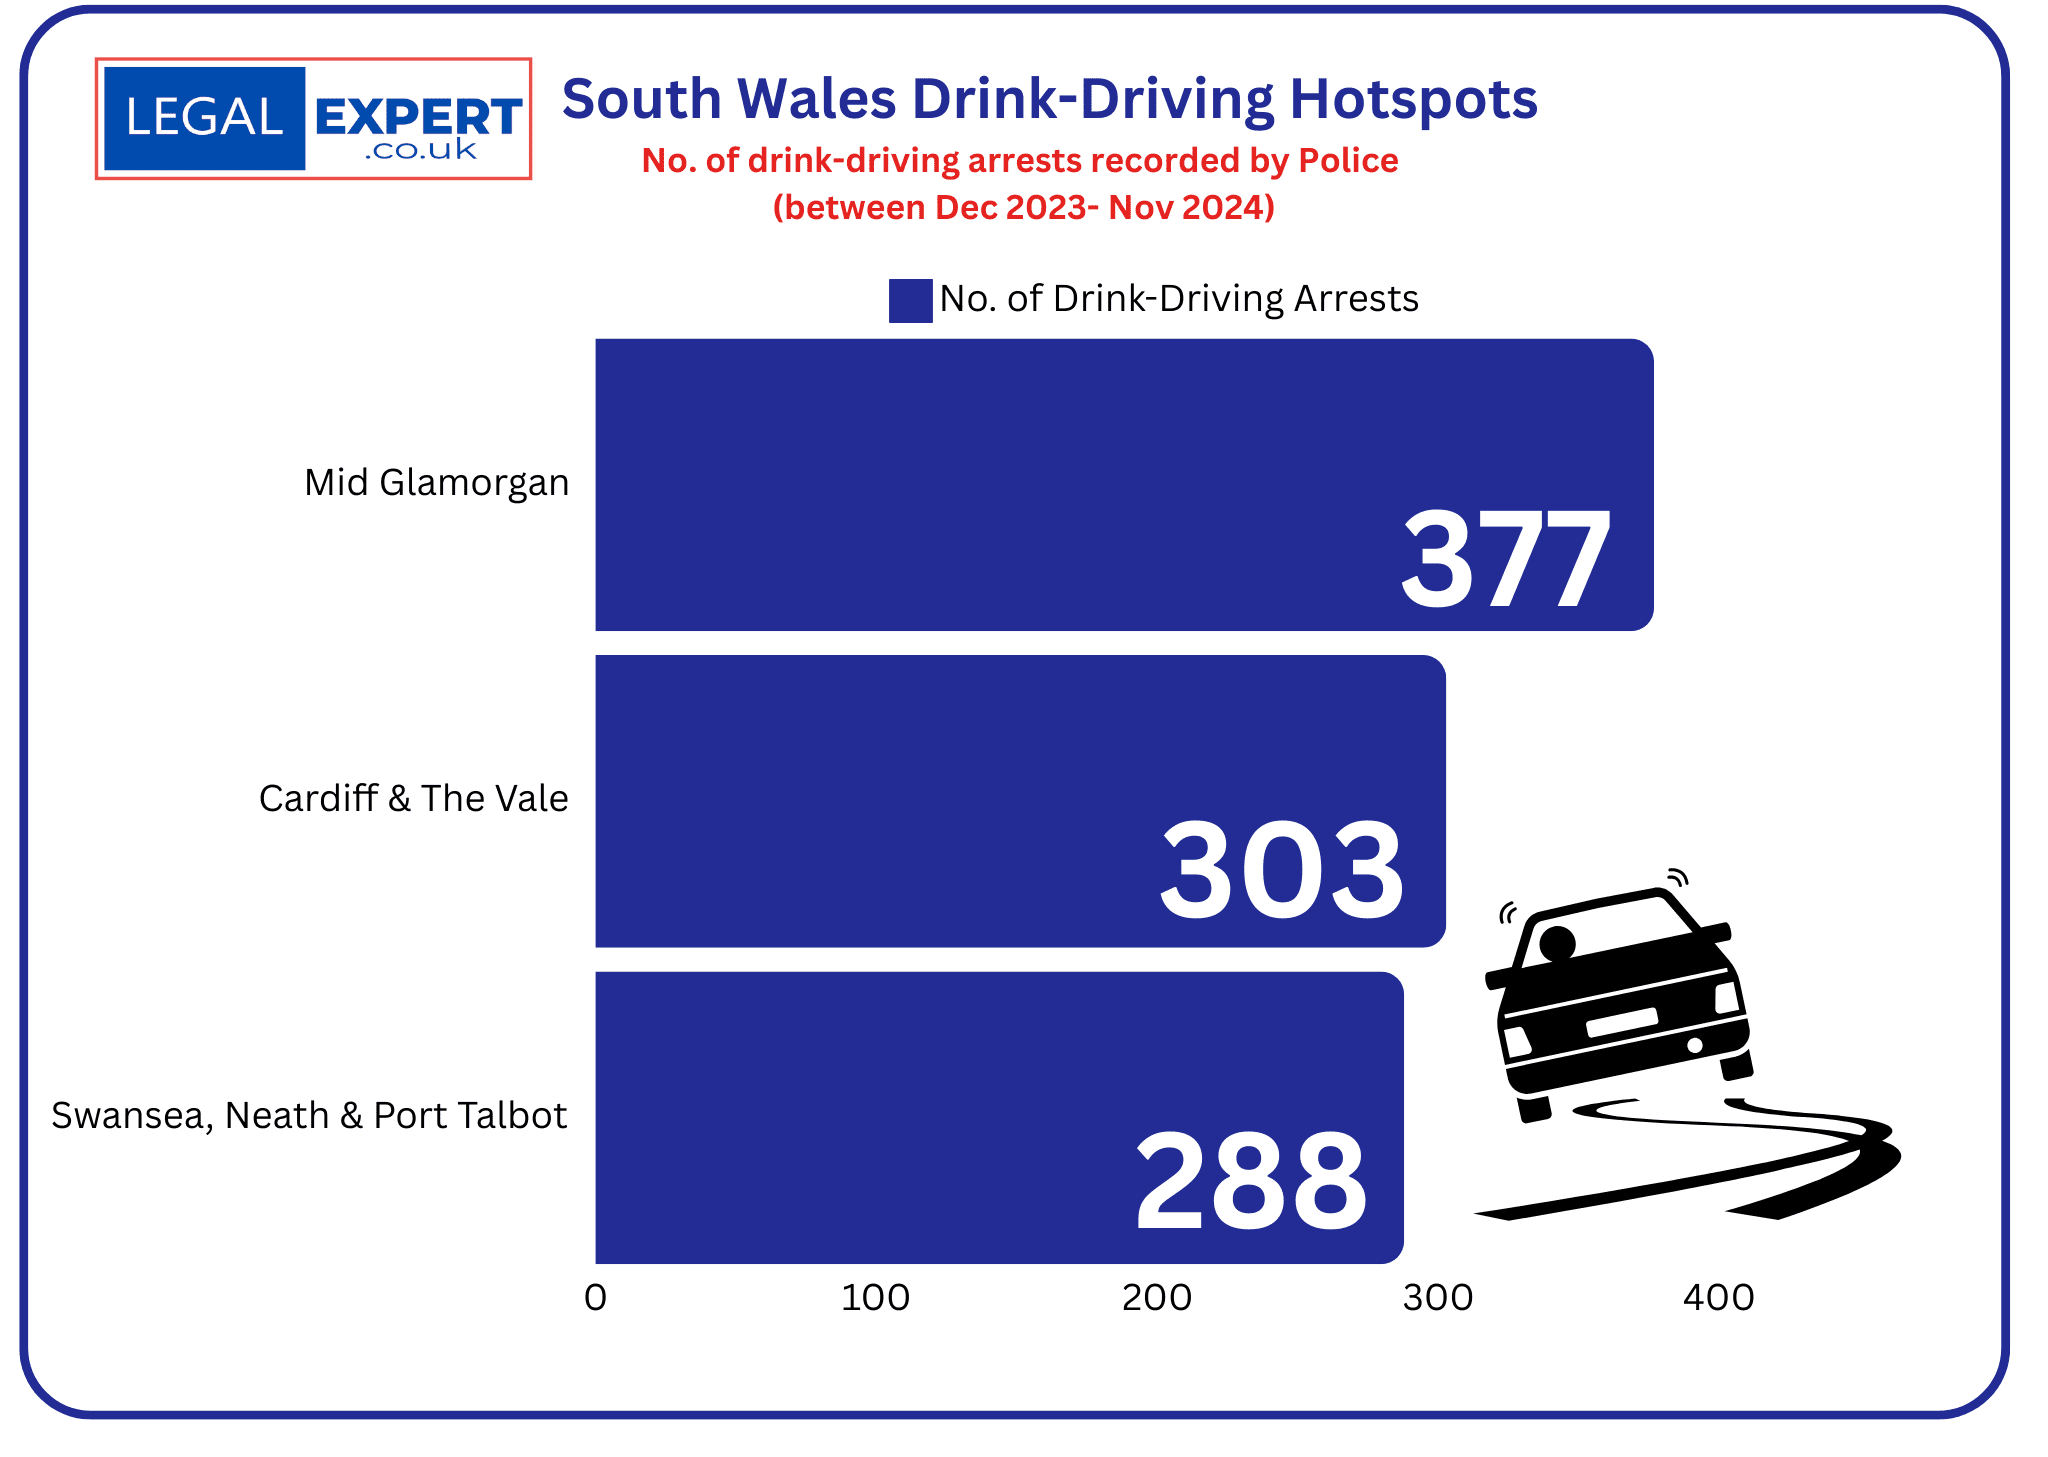
No. of drink-driving offences (between 2021-2024) | 3,333
No. of charges | 2,597 (78%)
For 2023/24:
Most Common Age Group | 25-34 (31%)
Gender | Female (244) | Male (743) 75%

No. of drink-driving arrests (between 2021-2024) | 3,201
No. of charges | 2,440 (76%)
For 2023/24:
Most Common Age Group | 31-60 (67%)
Gender | Female (199) | Male (863) 81%

No. of drink-driving arrests (between 2021-2024) | 2,379
No. of charges | 1,615 (68%)
For 2023/24:
Most Common Age Group | 30-49 (50%)
Gender | Female (141) | Male (660) 82%


No. of drink-driving arrests (between 2021-2024) | 3,007
No. of charges | 2,244 (75%)
For 2023/24:
Most Common Age Group | 30-34 (15%)
Gender | Female (140) | Male (568) 80%

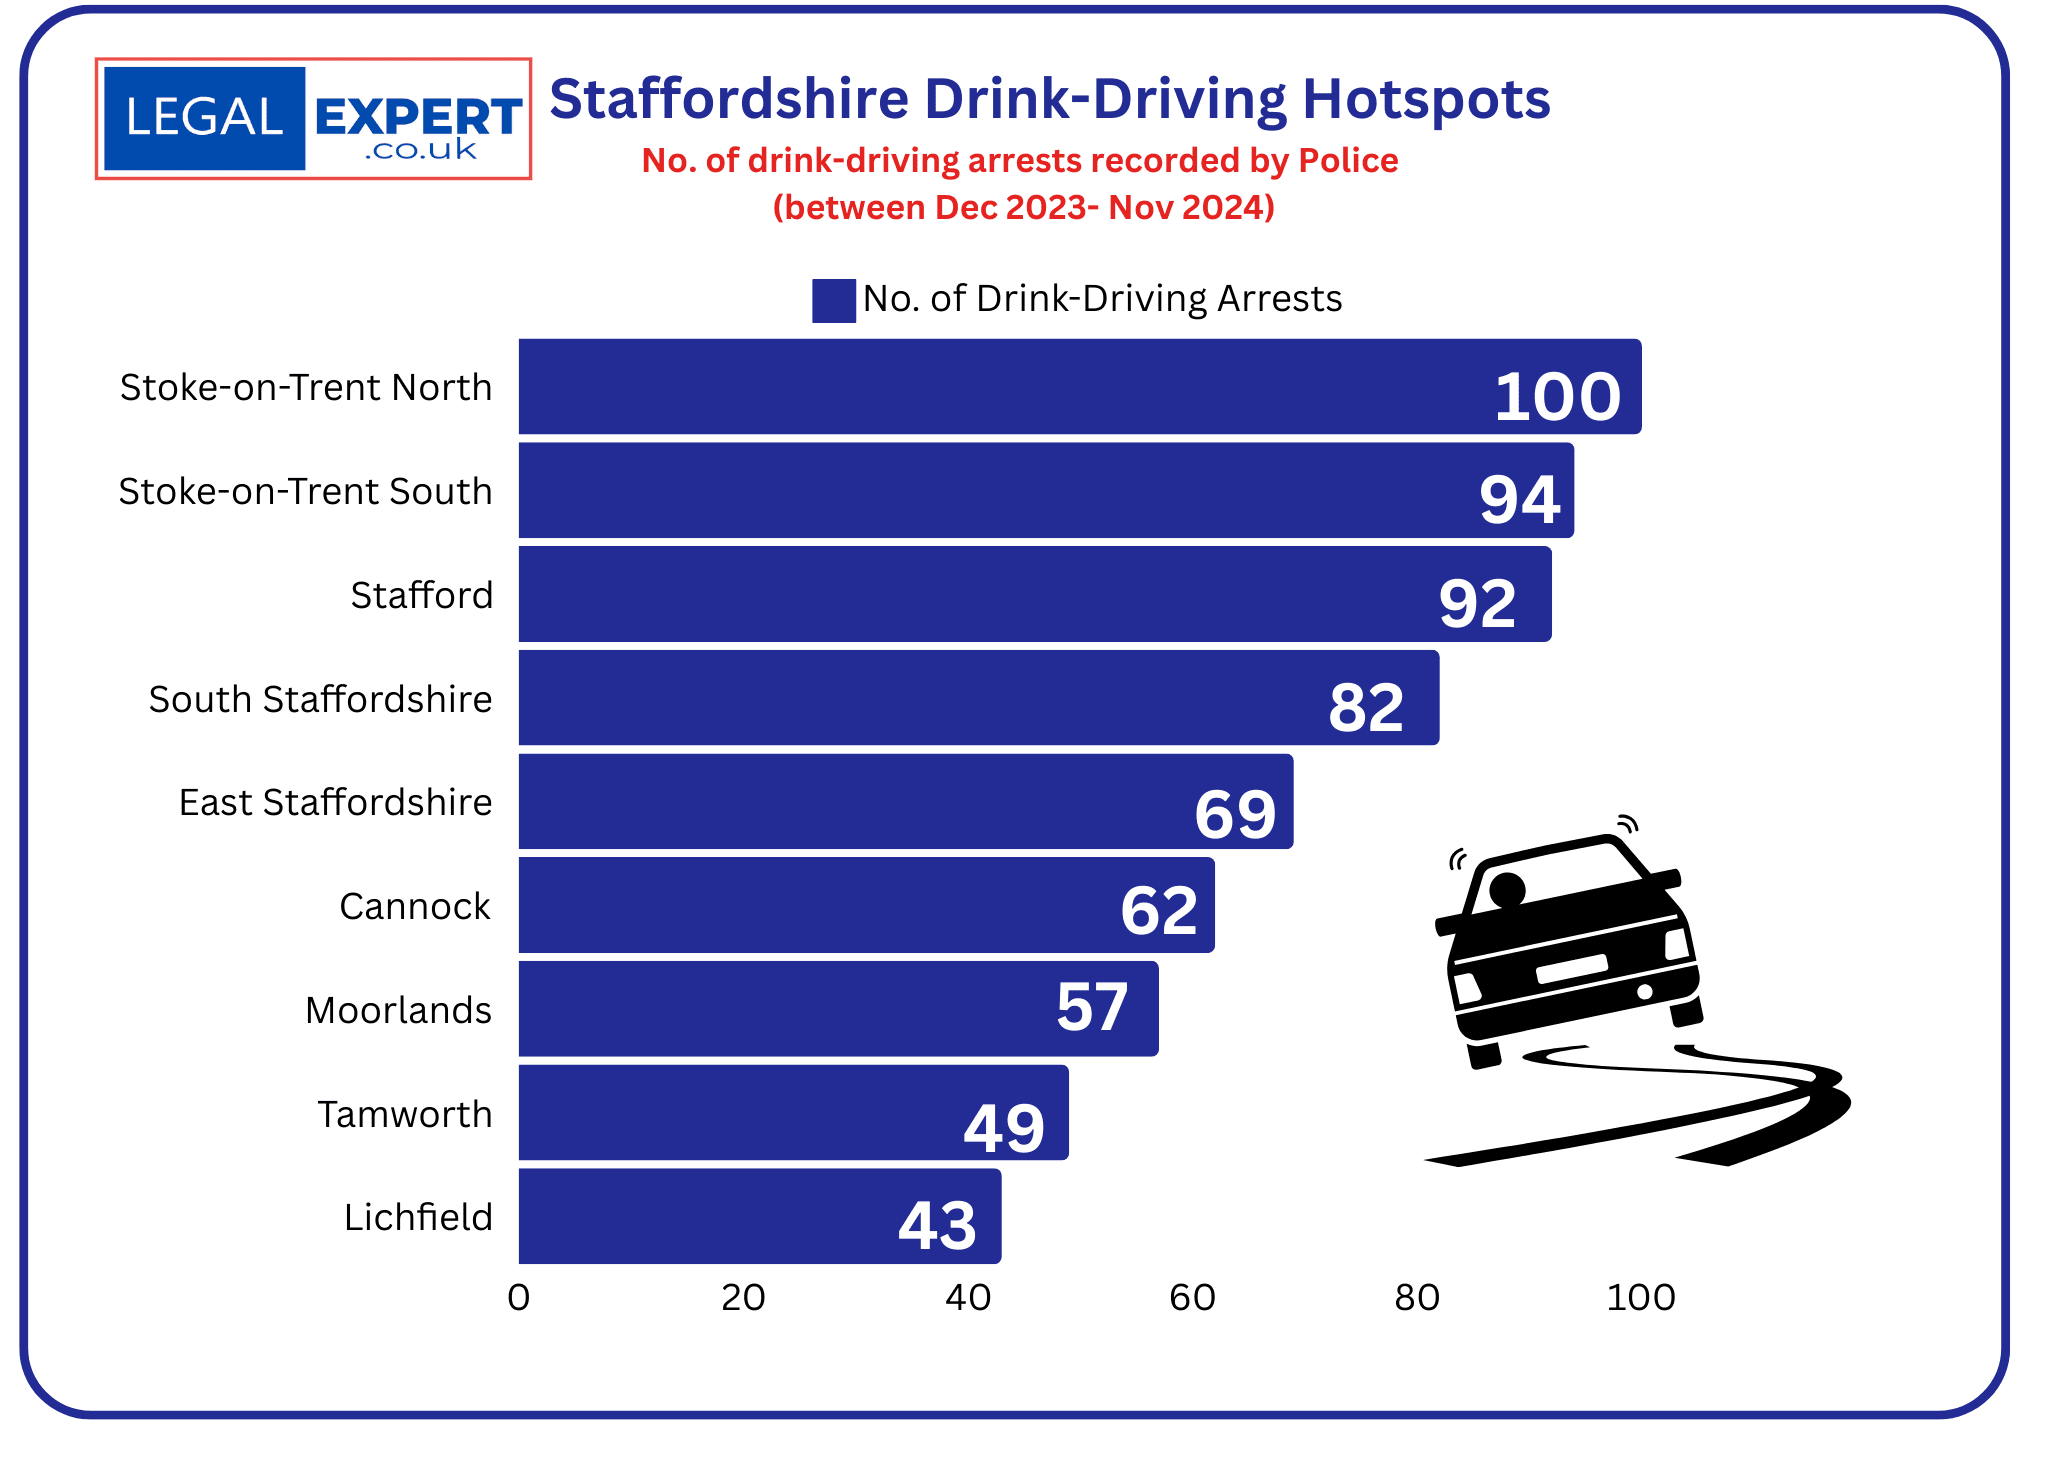
No. of drink-driving arrests (between 2021-2024) | 2,887
No. of charges | 1,875 (64%)
For 2023/24:
Most Common Age Group | 31-40 (26%)
Gender | Female (123) | Male (473) 79%
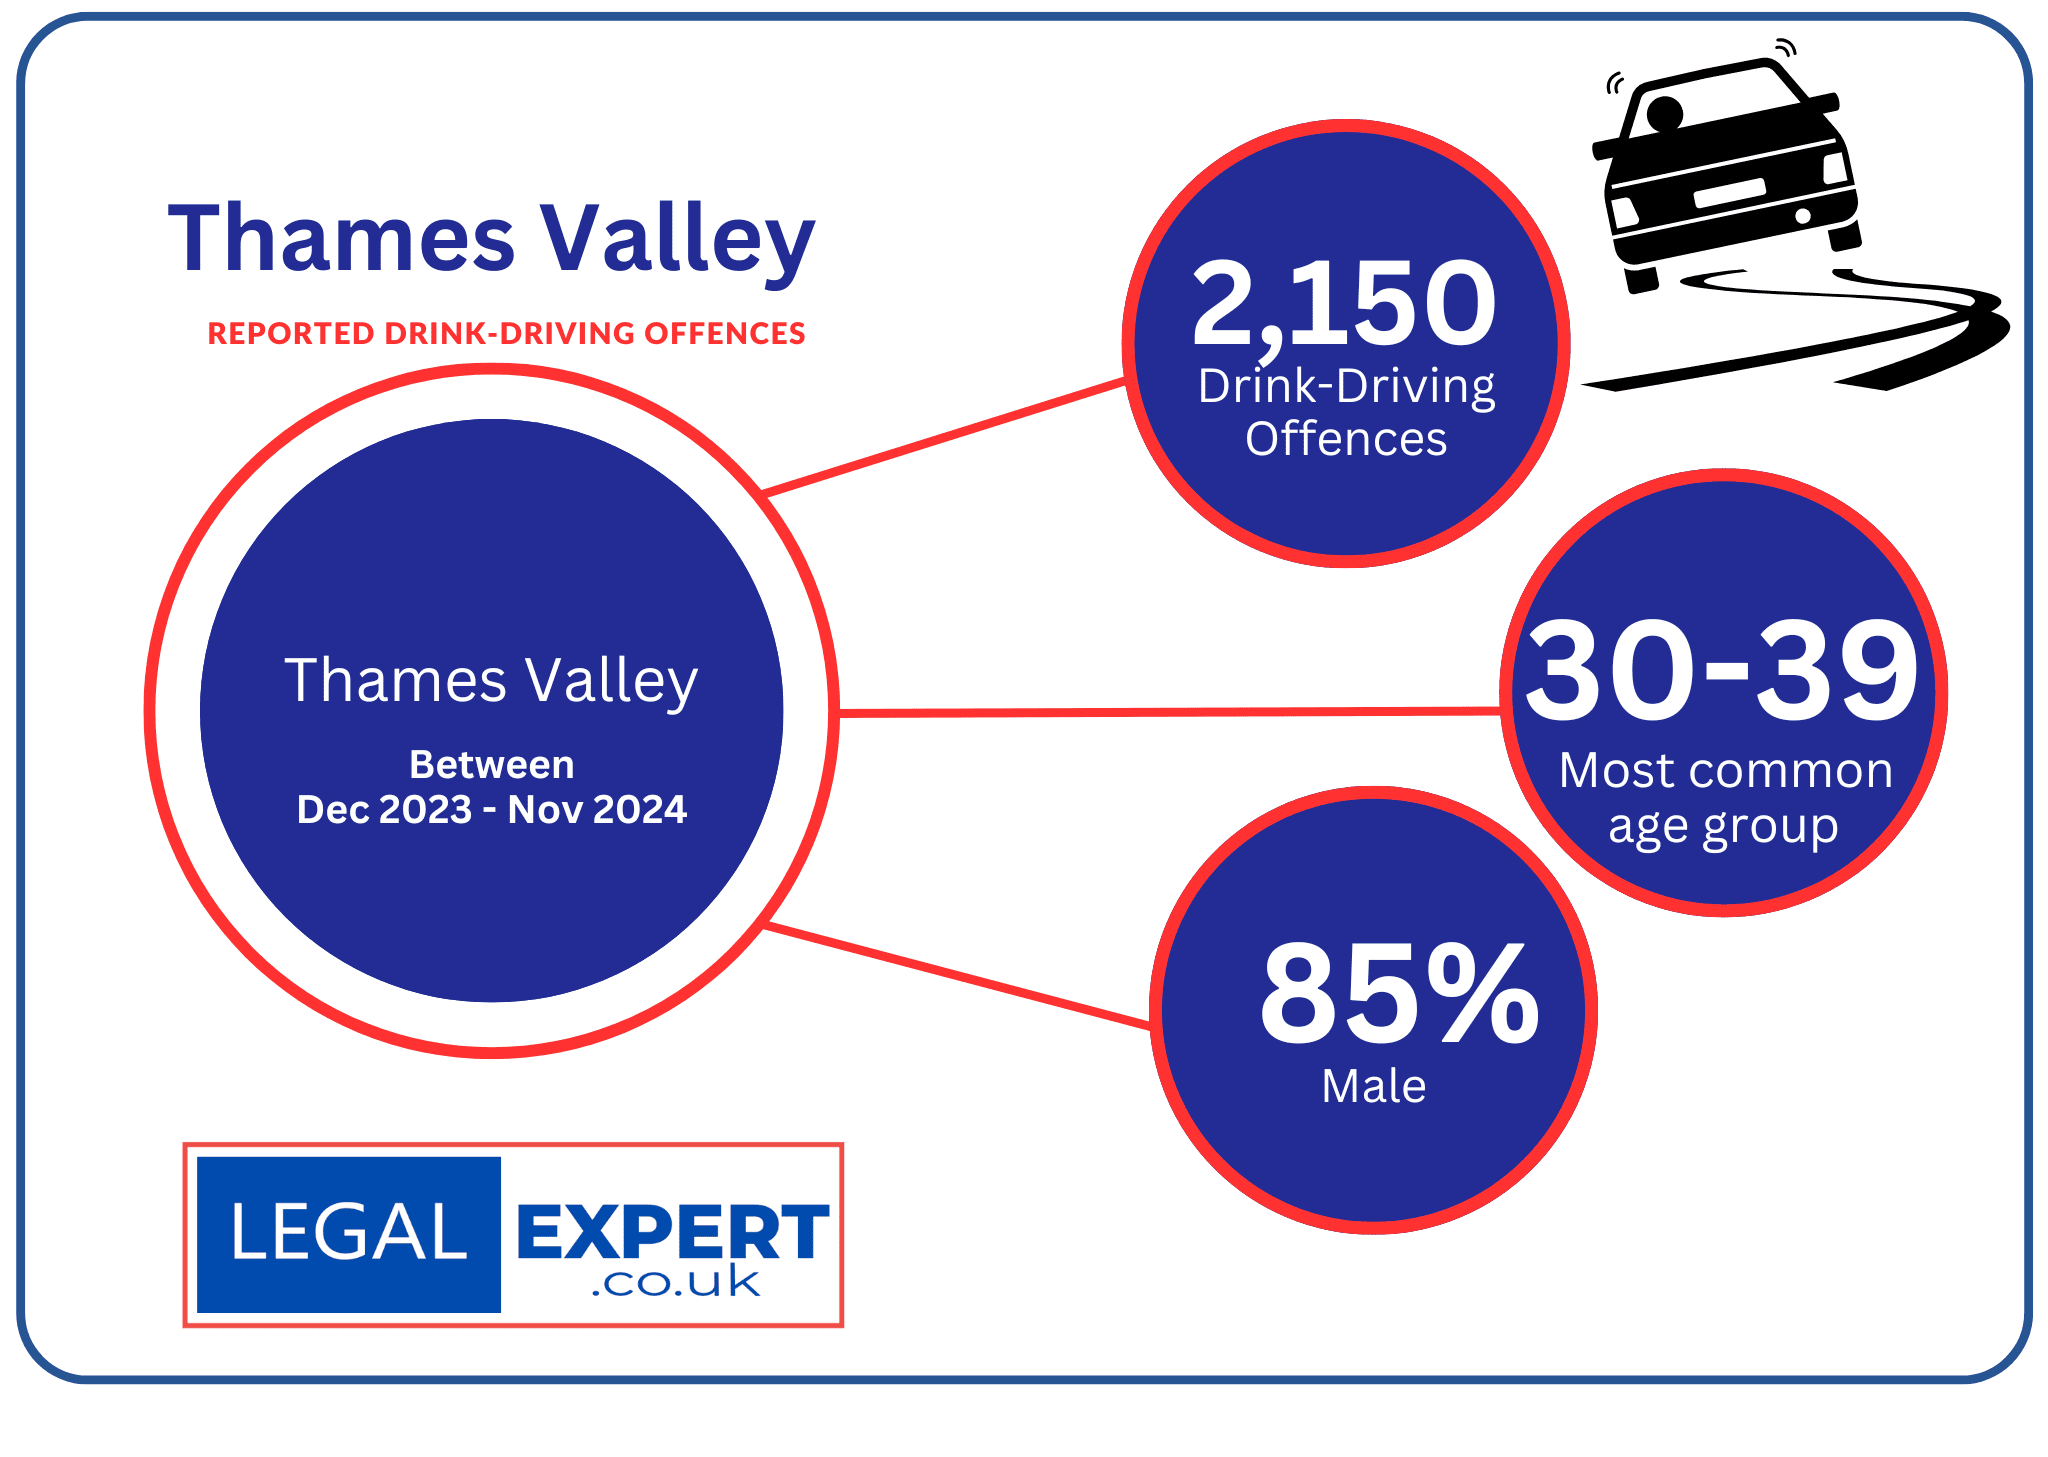
No. of drink-driving arrests (between 2023-2024) | 2,150
For 2023/24:
Most Common Age Group | 30-39 (31%)
Gender | Female (325) | Male (1819) 85%

No. of drink-driving arrests (between 2021-2024) | 7,270
No. of charges | 4,303 (59%)
For 2023/24:
Most Common Age Group | 20-29 (35%)
Gender | Female (275) | Male (1998) 85%

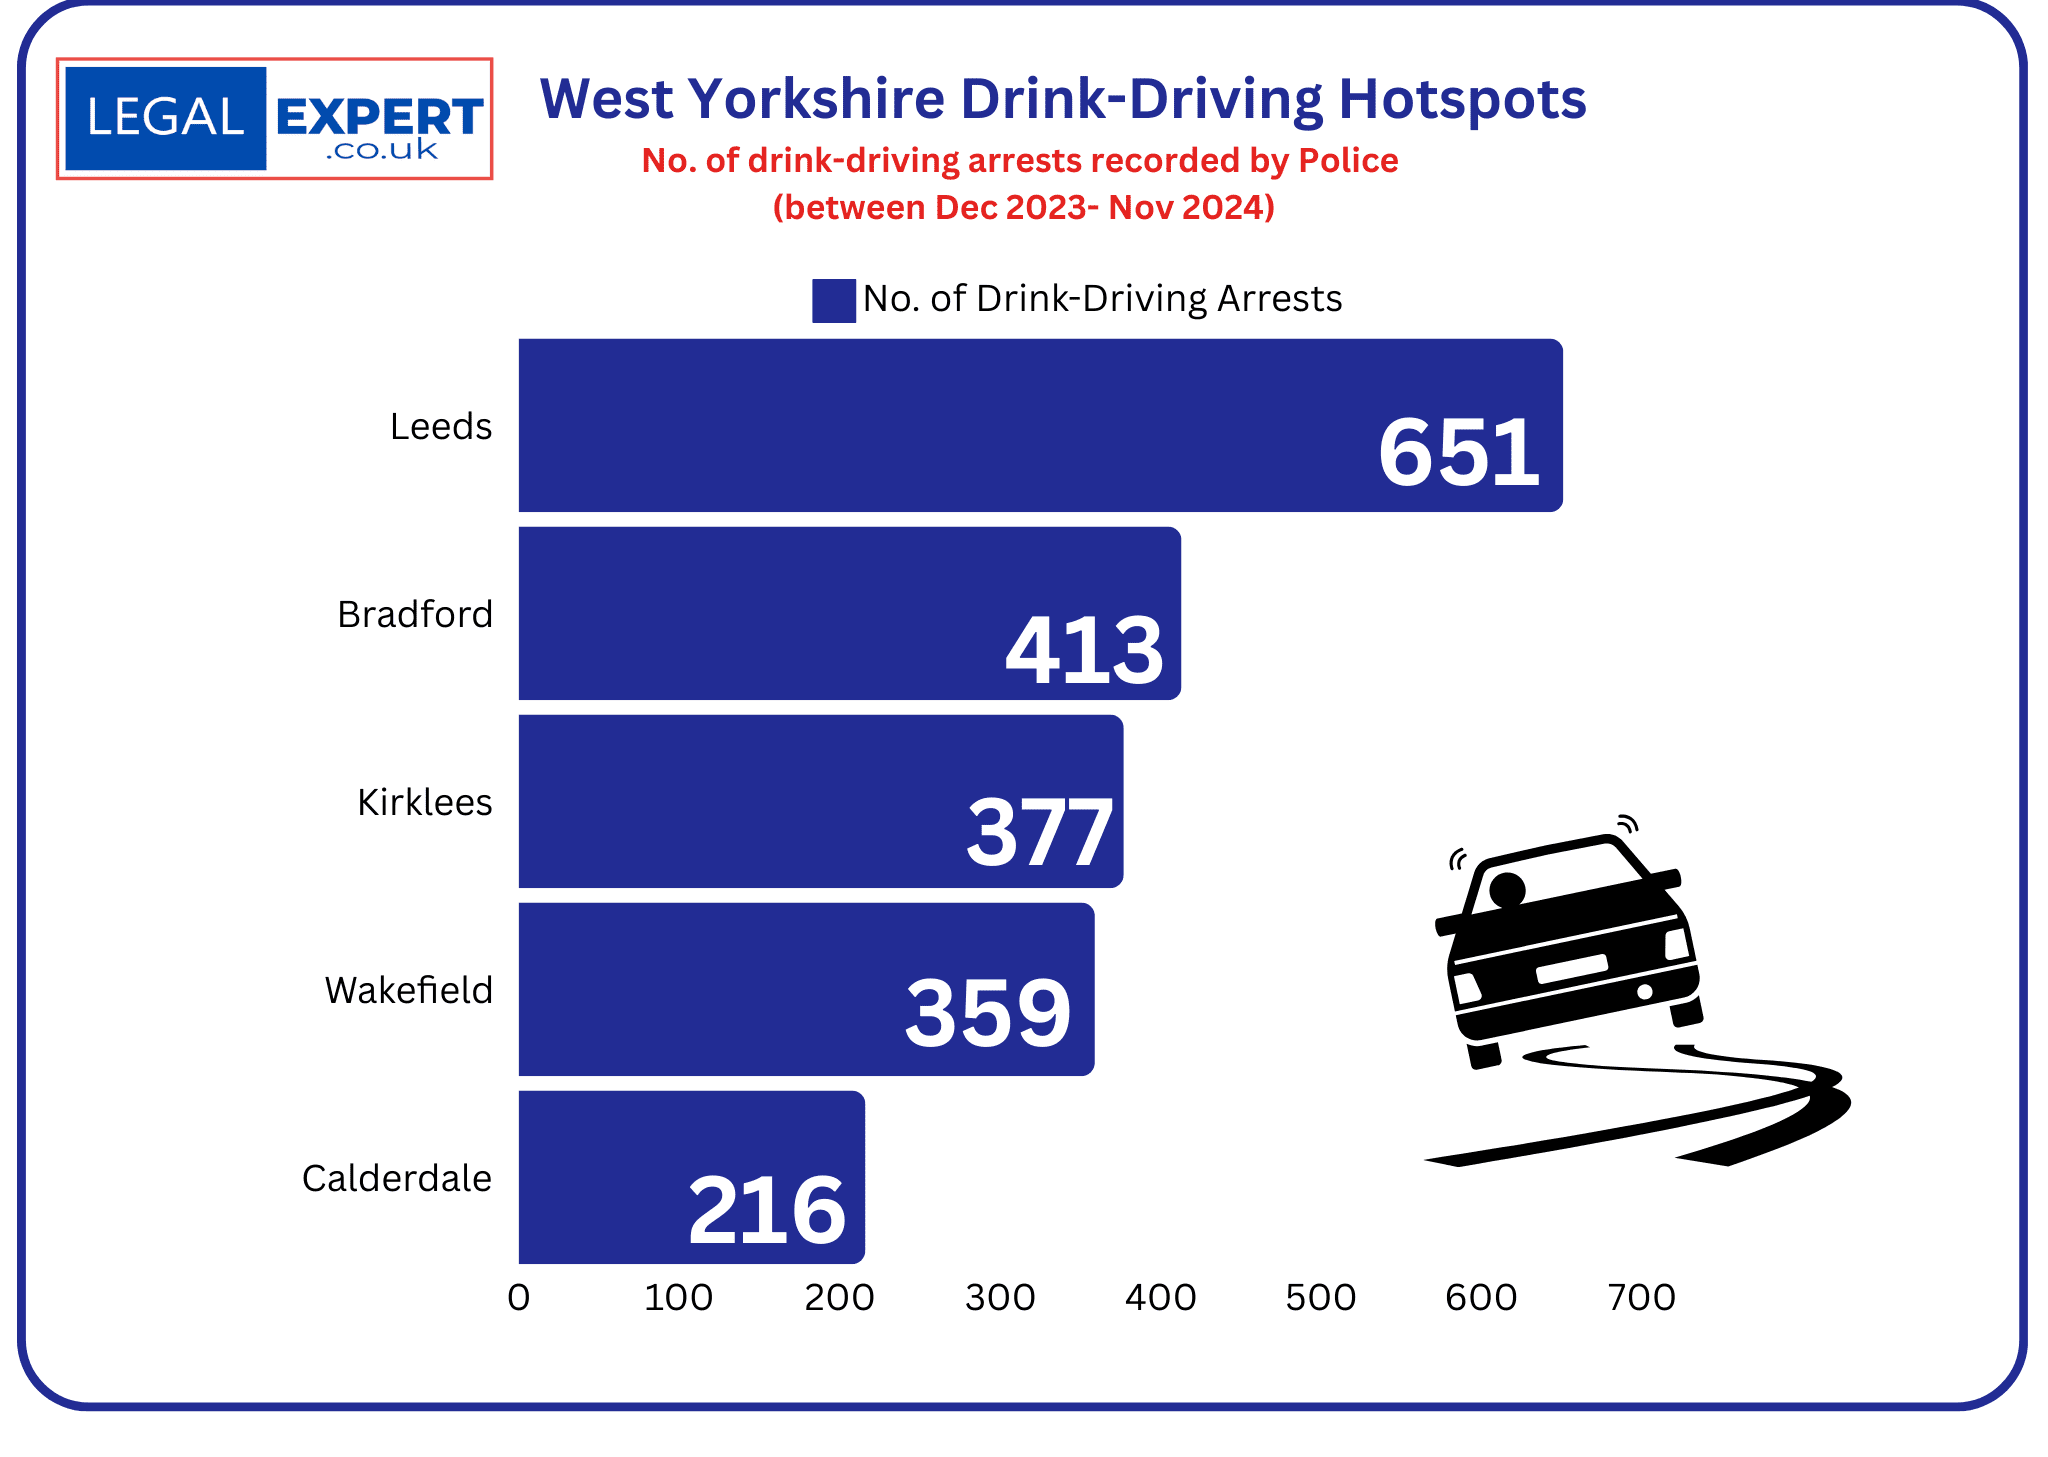
No. of drink-driving arrests (between 2021-2024) | 7,254
No. of charges | 5,685 (78%)
For 2023/24:
Most Common Age Group | 18-34 (43%)
Gender | Female (419) | Male (1751) 80%
No. of drink-driving arrests (between 2021-2024) | 1,903
For 2023/24:
Gender | Female (103) | Male (471) 82%